当涉及到网络图表时,有两种主要的重型打击: D3.js和 Chart.js。但有时你不需要500磅的大猩猩。有时你只想要简单的SVG图表,可以完成你期望的事情。这就是 Frappe Charts适合的地方。 这是一个小型的瓦尼拉JS库,提供功能齐全的动画,交互式SVG图表。
开始的
开始安装vue2-frappe(我假设你已经有一个Vue.js项目并运行了)。
1$ npm install --save vue2-frappe
接下来,启用插件(它所做的只是注册组件)。
 1import Vue from 'vue';
 2import VueFrappe from 'vue2-frappe';
 3import App from './App.vue';
 4
 5Vue.use(VueFrappe);
 6
 7new Vue({
 8  el: '#app',
 9  render: h => h(App)
10});
创建地图
「vue2-frappe」是Frappe 图表的简单包装程序,它简单地提供配置选项以作为组件属性点击。您可以直接使用 Frappe 图表的文档通过将顶级选项键更改为 Vue.js 属性绑定。
1[label App.vue]
2<template>
3 <div id="app">
4 <h2>Chart: Benedict's Weight</h2>
5 <!-- id - Every chart must have an id. -->
6 <!-- title - The title displayed on the chart -->
7 <!-- type - The type of chart: line, bar, percent, pie, or axis-mixed. -->
8 <!-- labels - Names for each value on the x-axis. -->
9 <!-- height- Optional: How tall the chart should be. -->
10 <!-- colors - Separate colors for each dataset. -->
11 <!-- lineOptions - Additional options for how to display line charts. See docs. -->
12 <!-- datasets - An array of objects containing names and values for each data set. -->
13 <vue-frappe
14 id="my-chart-id"
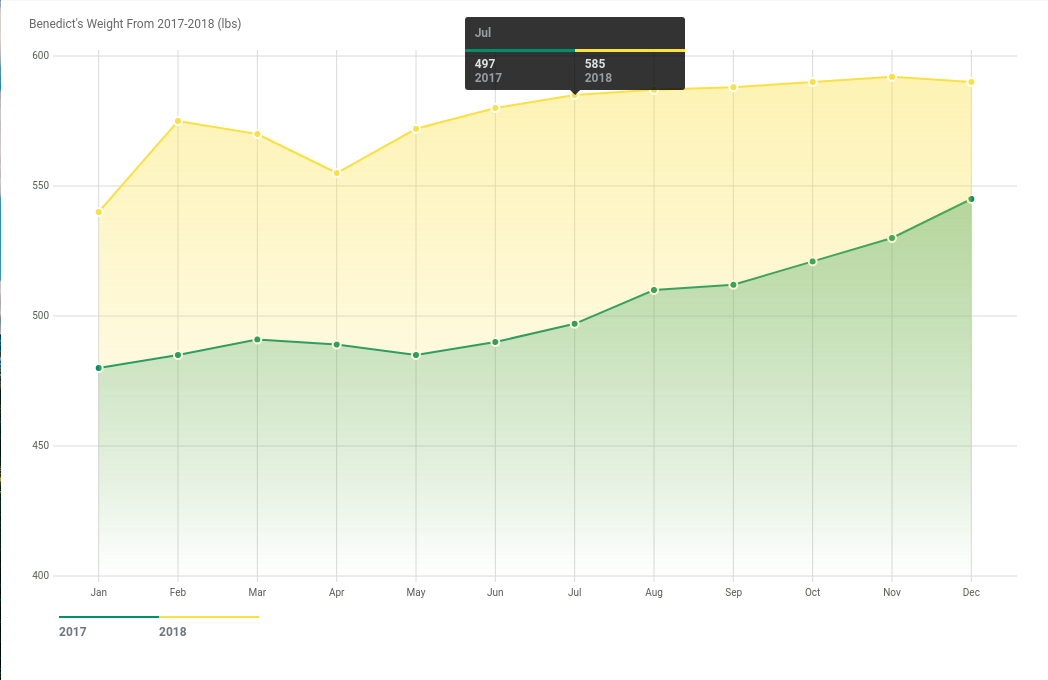
15 title="Benedict's Weight From 2017-2018 (lbs)"
16 type="line"
17 :labels="['Jan', 'Feb', 'Mar', 'Apr', 'May', 'Jun', 'Jul', 'Aug', 'Sep', 'Oct', 'Nov', 'Dec']"
18 :height="650"
19 :colors="['#008F68', '#FAE042']"
20 :lineOptions="{regionFill: 1}"
21 :datasets="[
22 {name: '2017', values: benedictsWeight2017},
23 {name: '2018', values: benedictsWeight2018}
24 ]"
25 ></vue-frappe>
26 <p>Conclusion: Benedict needs to go on a diet.</p>
27 </div>
28</template>
29
30<script>
31
32export default {
33 name: 'app',
34 data() {
35 return {
36 benedictsWeight2017: [480, 485, 491, 489, 485, 490, 497, 510, 512, 521, 530, 545],
37 benedictsWeight2018: [540, 575, 570, 555, 572, 580, 585, 587, 588, 590, 592, 590]
38 }
39 }
40}
41</script>
上面的结果应该是像下面那样的图表:
Frappe 图表支持各种其他类型的图表 - 饼干图表,条形图表,百分比图表,热图表,以及高级线和混合图表。