介绍
Chart.js是使用HTML5<canvas>元素创建清洁图形的强大方法.使用Vue的data()对象,可以存储数据并操纵它以在需要时更改图形。
在本文中,您将在样本Vue项目中使用Chart.js来显示太阳系中的行星信息。
前提条件
要完成本教程,您将需要:
- Node.js 本地安装,您可以按照 如何安装 Node.js 和创建本地开发环境进行操作。 *对 设置 Vue.js 项目和 使用 Vue.js 组件的一些熟悉可能是有益的.
本教程已通过 Node v15.11.0, npm v7.6.1, vue v2.6.11 和 Chart.js v2.9.4 进行验证。
步骤1 - 设置项目
要快速设置项目,本文将建议使用 @vue/cli。
<$>[注]
**注:**本文将采用使用npx的方法,以避免全球安装@vue/cli;
<$>
1npx @vue/cli create vue-chartjs-example --default
导航到新创建的项目目录;
1cd vue-async-computed-example
Chart.js 可以通过npm来安装,使用以下命令:
1npm install [email protected]
此时,您将有一个支持 Chart.js 的新的 Vue 项目。
步骤 2 – 创建图表组件
该图表将由两个数据集组成:
太阳系中的每个行星都有月亮的数量 2.太阳系中的每个行星的质量
使用这两个数据集,我们可以有不同的图表类型来显示数据中的相关性。
打开代码编辑器,在src目录和components子目录下,创建一个新的PlanetChart.vue文件。
每个 Chart.js 图表都需要在 HTML 标记中有一个<canvas>。
 1[label PlanetChart.vue]
 2<template>
 3  <div>
 4    <canvas id="planet-chart"></canvas>
 5  </div>
 6</template>
 7
 8<script>
 9import Chart from 'chart.js'
10
11export default {
12  name: 'PlanetChart'
13}
14</script>
接下来,您将更改App.vue文件以使用新的PlanetChart:
 1[label src/App.vue]
 2<template>
 3  <div id="app">
 4    <PlanetChart/>
 5  </div>
 6</template>
 7
 8<script>
 9import PlanetChart from './components/PlanetChart.vue'
10
11export default {
12  name: 'App',
13  components: {
14    PlanetChart
15  }
16}
17</script>
将更改保存到您的文件中。
为了将组件和配置分开,您将为图表数据创建一个新的文件。
步骤 3 – 创建图表数据
使用 Chart.js 创建图表看起来如下:
1const ctx = document.getElementById('example');
2const exampleChart = new Chart(ctx, {
3  type: '',
4  data: [],
5  options: {},
6});
一个<canvas>元素与一个类型,数据和选项一起传入。
您将创建一个定义这些值的新文件. 打开代码编辑器,在src目录下,创建一个新的planet-data.js文件. 请记住,您将希望根据数据给它一个独特的描述性名称。
添加以下代码行到 planet-data.js:
 1[label src/planet-data.js]
 2export const planetChartData = {
 3  type: "line",
 4  data: {
 5    labels: ["Mercury", "Venus", "Earth", "Mars", "Jupiter", "Saturn", "Uranus", "Neptune"],
 6    datasets: [
 7      {
 8        label: "Number of Moons",
 9        data: [0, 0, 1, 2, 79, 82, 27, 14],
10        backgroundColor: "rgba(54,73,93,.5)",
11        borderColor: "#36495d",
12        borderWidth: 3
13      },
14      {
15        label: "Planetary Mass (relative to the Sun x 10^-6)",
16        data: [0.166, 2.081, 3.003, 0.323, 954.792, 285.886, 43.662, 51.514],
17        backgroundColor: "rgba(71, 183,132,.5)",
18        borderColor: "#47b784",
19        borderWidth: 3
20      }
21    ]
22  },
23  options: {
24    responsive: true,
25    lineTension: 1,
26    scales: {
27      yAxes: [
28        {
29          ticks: {
30            beginAtZero: true,
31            padding: 25
32          }
33        }
34      ]
35    }
36  }
37};
38
39export default planetChartData;
将类型设置为行。数据将由两个数据集组成,即背景颜色,边界颜色和边界宽度。
<$>[注]
注: 您可以参考 Chart.js 文档 有关线图的更多信息,以及其他信息,如 bar, polarArea, radar, pie和 doughnut。
通过导出planetChartData,您允许将const导入到另一个JavaScript文件中。更重要的是,您正在将数据从组件中分开。
修订PlanetChart组件并添加planetChartData:
1[label src/components/PlanetChart.vue]
2<script>
3import Chart from 'chart.js'
4import planetChartData from '../planet-data.js'
5
6export default {
7  name: 'PlanetChart'
8}
9</script>
接下来,将图表数据存储在data()函数中。
 1[label src/components/PlanetChart.vue]
 2<script>
 3import Chart from 'chart.js'
 4import planetChartData from '../planet-data.js'
 5
 6export default {
 7  name: 'PlanetChart',
 8  data() {
 9    return {
10      planetChartData: planetChartData
11    }
12  }
13}
14</script>
<$>[注] 注: 您也可以使用 ES6 短语. 由于数据属性和值具有相同的名称,您可以只使用「planetChartData」而不是「planetChartData: planetChartData」。
在此时,应该安装 Chart.js,并将图表的数据导入到PlanetChart组件中。
您应该已经在组件的模板中创建了一个<canvas>元素,在此时,是时候初始化图表并写入<canvas>。
修订PlanetChart组件并在mounted()生命周期方法中添加创建图表:
 1[label src/components/PlanetChart.vue]
 2<script>
 3import Chart from 'chart.js'
 4import planetChartData from '../planet-data.js'
 5
 6export default {
 7  name: 'PlanetChart',
 8  data() {
 9    return {
10      planetChartData: planetChartData
11    }
12  },
13  mounted() {
14    const ctx = document.getElementById('planet-chart');
15    new Chart(ctx, this.planetChartData);
16  }
17}
18</script>
将更改保存到您的文件中。
现在,您可以使用您的终端运行您的应用程序:
1npm run serve
在您的 Web 浏览器中打开应用程序:
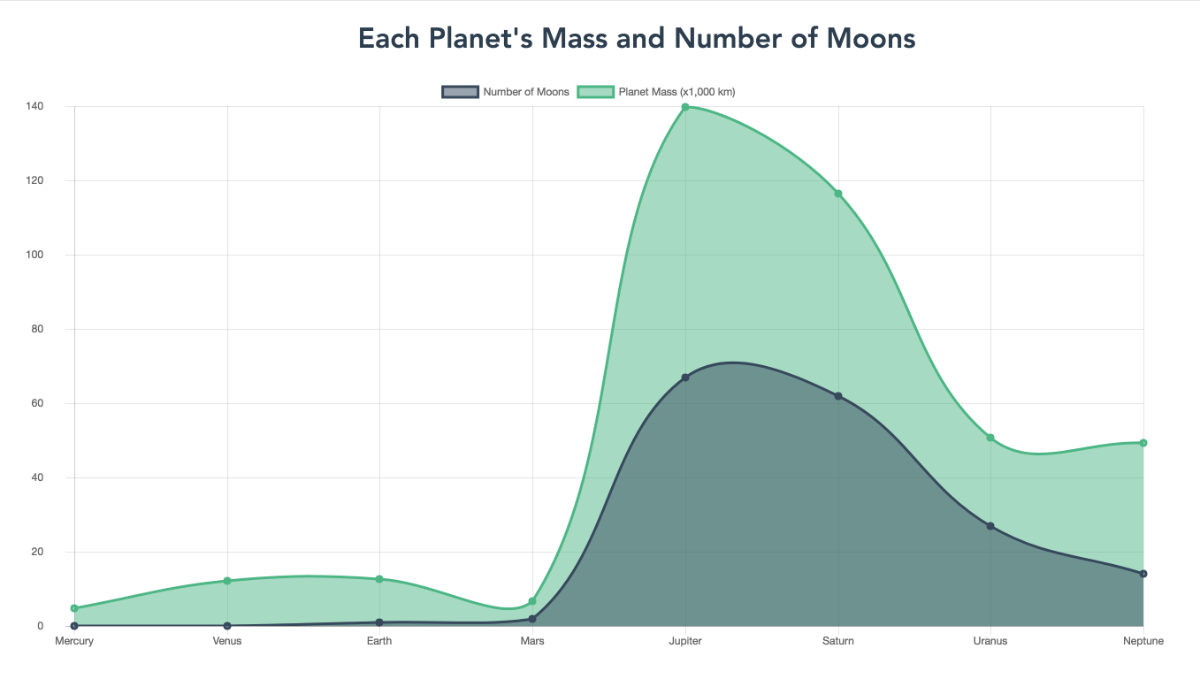
将有两个线图. 一个图显示了每个行星的卫星数量. 另一个图显示了每个行星的质量。 背景颜色, 边界颜色和 边界宽度值影响了图表的外观。 与线上的点互动会显示标签。
步骤 4 – 显示混合图表
Chart.js 还支持混合图表. 在本节中,您将更改图表的配置,从线图到月球数据集的线图和大数据集的线图的混合。
用您的代码编辑器修复planet-data.js。修改图表数据的类型属性,并将其更改为栏。
1[label src/planet-data.js]
2export const planetChartData = {
3  type: "bar",
4  data: { ... },
5  options: { ... }
6};
7
8export default planetChartData;
在此时,这两个图表将是条形图。
但是,您想要显示一个组合的条形图和条形图。 要更改这一点,在每个数据集对象中,在标签属性下添加一个类型属性。 对于第一个数据集对象,给它一个具有行值的类型属性,对于第二个,给它一个具有栏值的类型属性:
 1[label src/planet-data.js]
 2export const planetChartData = {
 3  type: "bar",
 4  data: {
 5    labels: ["Mercury", "Venus", "Earth", "Mars", "Jupiter", "Saturn", "Uranus", "Neptune"],
 6    datasets: [
 7      {
 8        label: "Number of Moons",
 9        type: "line',
10        data: [0, 0, 1, 2, 79, 82, 27, 14],
11        backgroundColor: "rgba(54,73,93,.5)",
12        borderColor: "#36495d",
13        borderWidth: 3
14      },
15      {
16        label: "Planetary Mass (relative to the Sun x 10^-6)",
17        type: "bar",
18        data: [0.166, 2.081, 3.003, 0.323, 954.792, 285.886, 43.662, 51.514],
19        backgroundColor: "rgba(71, 183,132,.5)",
20        borderColor: "#47b784",
21        borderWidth: 3
22      }
23    ]
24  },
25  options: { ... }
26};
27
28export default planetChartData;
将更改保存到您的文件中。
现在,您可以使用您的终端运行您的应用程序:
1npm run serve
在您的 Web 浏览器中打开应用程序:
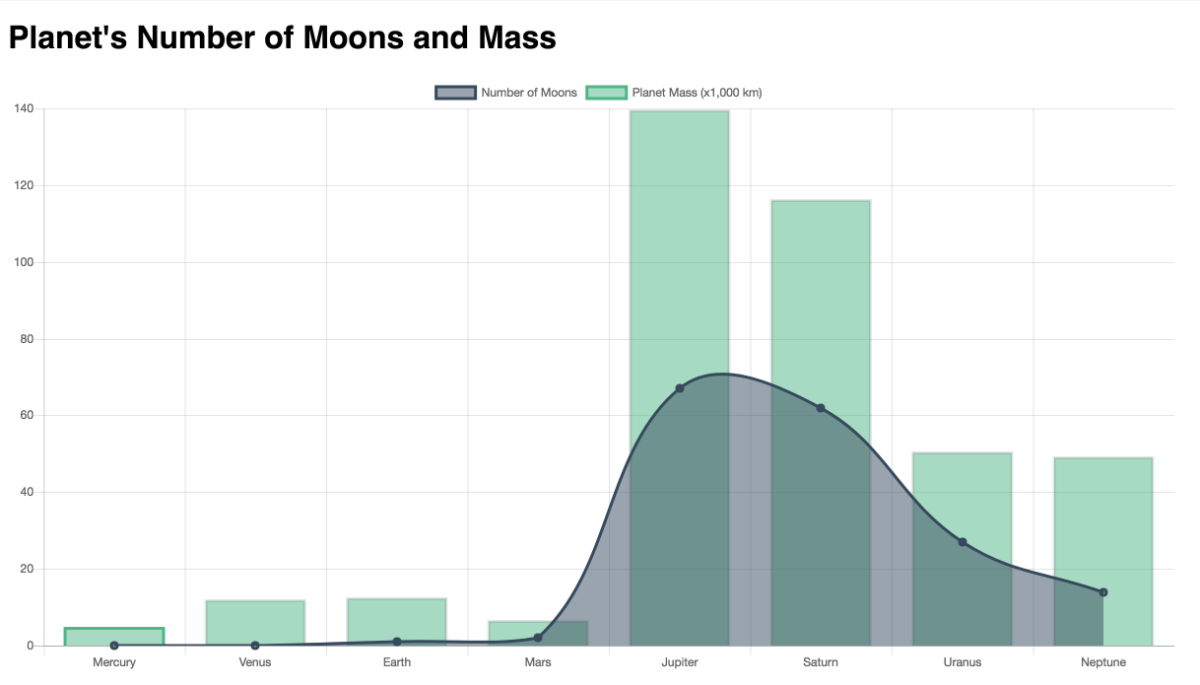
每个行星的卫星数量显示为线图,每个行星的质量显示为线图。
结论
在本文中,您在样本Vue项目中使用了Chart.js来显示太阳系中的行星信息。
Chart.js 可用于其他数据可视化,请浏览 样品以获取如何将其纳入您的项目的灵感。