作者选择了 Diversity in Tech基金,作为 Write for Donations计划的一部分接受捐款。
介绍
Prometheus是一个开源监控系统,从您的服务中收集指标,Prometheus 2.0带来了许多变化和改进,例如一个新的时间序列数据库,更好的资源使用,通知的新配置格式和更好的Alertmanager发现。
在本教程中,您将升级现有的 Prometheus 1.x 安装到 Prometheus 2.0. Prometheus 2.0 中的新的时间序列数据库,称为 tsdb,与 Prometheus 1.x 不兼容,这意味着您无法通过 Prometheus 2 读取 Prometheus 1.x 实例的数据。
Prometheus 2 使用了新的警报规则格式,因此您可以将现有警报规则更新到新的格式,并与 Alertmanager 合作。
最后,您将使用 Web UI 确保 Prometheus 按预期工作。
此教程只涵盖最重要的更改. 在升级到最新版本之前,您应该阅读 公告 Prometheus 2.0 以确保您不受其他任何更改的影响。
前提条件
要遵循这个教程,你需要:
- 一个 Ubuntu 16.04 服务器通过遵循 Initial Server Setup with Ubuntu 16.04 教程,包括一个 sudo 非根用户和防火墙。
- Prometheus 1.x 安装在您的服务器上,包括 Prometheus Web UI. 您可以通过运行
prometheus -version命令来找到您的 Prometheus 版本。
本教程假设您对 Prometheus 安装的下列内容:
- 您创建了 prometheus用户.
- 您创建了包含 Prometheus 配置文件的
/etc/prometheus目录. - 您创建了包含 Prometheus 数据的
/var/lib/prometheus目录. - 位于
/usr/local/bin的prometheus和promtool执行器。
步骤 1 — 升级 Prometheus 到 1.8.2
为了使用 Prometheus 2.0 访问旧数据,您需要将当前的 Prometheus 安装升级到版本 1.8.2,然后将 Prometheus 2.0 设置为使用 remote_read 功能从旧版本中读取。
使用「prometheus -version」命令,查看您目前的 Prometheus 版本. 输出包含版本和构建信息. 如果您已经运行版本 1.8.2,跳过此步骤。
1prometheus -version
1[secondary_label prometheus -version output]
2prometheus, version 1.7.1 (branch: master, revision: 3afb3fffa3a29c3de865e1172fb740442e9d0133)
3  build user:       root@0aa1b7fc430d
4  build date:       20170612-11:44:05
5  go version:       go1.8.3
在您走得更远之前,请停止 Prometheus,以便您可以更换其文件:
1sudo systemctl stop prometheus
您可以在该项目的 GitHub 发布页面上找到 Prometheus 1.8.2 以及检查总和,您需要一个名为 prometheus-1.8.2.linux-amd64.tar.gz 的文件。
1cd ~
2curl -LO https://github.com/prometheus/prometheus/releases/download/v1.8.2/prometheus-1.8.2.linux-amd64.tar.gz
3curl -LO https://github.com/prometheus/prometheus/releases/download/v1.8.2/sha256sums.txt
若要確定您擁有真正的非破壞檔案,請使用「sha256sum」命令生成檔案的檢查總和,並與「sha256sums.txt」檔案進行比較。
1sha256sum -c sha256sums.txt 2>&1 | grep OK
1[secondary_label Checksums check]
2prometheus-1.8.2.linux-amd64.tar.gz: OK
如果输出中看不到OK,请删除下载的档案,然后跟踪上面的步骤来重新下载。
现在,解包档案。
1tar xvf prometheus-1.8.2.linux-amd64.tar.gz
将Prometheus和promtool执行程序复制到/usr/local/bin目录。
1sudo cp prometheus-1.8.2.linux-amd64/prometheus /usr/local/bin
2sudo cp prometheus-1.8.2.linux-amd64/promtool /usr/local/bin
将文件的用户和组所有权设置为 prometheus用户。
1sudo chown prometheus:prometheus /usr/local/bin/prometheus
2sudo chown prometheus:prometheus /usr/local/bin/promtool
最后,开始Prometheus,以确保它按预期工作。
1sudo systemctl start prometheus
最后,检查服务的状态。
1sudo systemctl status prometheus
您将看到以下输出:
 1[secondary_label Prometheus service status]
 2● prometheus.service - Prometheus
 3   Loaded: loaded (/etc/systemd/system/prometheus.service; enabled; vendor preset: enabled)
 4   Active: active (running) since Mon 2018-01-01 21:44:52 UTC; 2s ago
 5 Main PID: 1646 (prometheus)
 6    Tasks: 6
 7   Memory: 17.7M
 8      CPU: 333ms
 9   CGroup: /system.slice/prometheus.service
10           └─1646 /usr/local/bin/prometheus -config.file /etc/prometheus/prometheus.yml -storage.local.path /var/lib/prometheus/
11...
如果服务状态不活跃,请遵循屏幕日志并追踪上面的步骤以解决问题,然后继续本教程。
检查 Prometheus 版本,以确保您正在运行版本 1.8.2。
1prometheus -version
1[secondary_label prometheus -version output]
2prometheus, version 1.8.2 (branch: HEAD, revision: 5211b96d4d1291c3dd1a569f711d3b301b635ecb)
3  build user:       root@1412e937e4ad
4  build date:       20171104-16:09:14
5  go version:       go1.9.2
如果您看不到「1.8.2 版本」,請確定您已下載正確的檔案,並重複本節中的步驟。
最后,删除您下载的文件,因为您不再需要它们。
1rm -rf prometheus-1.8.2.linux-amd64.tar.gz prometheus-1.8.2.linux-amd64
接下来,您将重新配置现有安装,以免在安装后干扰 Prometheus 2.0。
步骤 2 — 将 Prometheus 1.8.2 配置为单独服务
我们希望保持 Prometheus 1.8.2 周围,以便我们可以访问旧数据,但我们需要确保在我们安装 Prometheus 2 时,我们的旧安装不会干扰 Prometheus 2. 为此,我们将添加1到所有 Prometheus 相关的目录和可执行的名称中。
在继续之前,停止 Prometheus,这样您就可以更名文件和目录。
1sudo systemctl stop prometheus
在/usr/local/bin目录中,你会找到两个 Prometheus 执行,即prometheus和promtool,分别重命名为prometheus1和promtool1:
1sudo mv /usr/local/bin/prometheus /usr/local/bin/prometheus1
2sudo mv /usr/local/bin/promtool /usr/local/bin/promtool1
Prometheus 有两个相关的目录: /etc/prometheus,用于存储配置文件,和 /var/lib/prometheus,用于存储数据。
1sudo mv /etc/prometheus /etc/prometheus1
2sudo mv /var/lib/prometheus /var/lib/prometheus1
我们将运行 Prometheus 1.8.2 作为一个只读的数据存储,所以我们不需要它从出口商那里收集任何数据。为了确保这一点,我们将使用以下断开命令从配置文件中删除所有内容。
1sudo cp /etc/prometheus1/prometheus.yml /etc/prometheus1/prometheus.yml.bak
然后用truncate清除配置文件的内容。
1sudo truncate -s 0 /etc/prometheus1/prometheus.yml
接下来,将服务文件的名称从Prometheus改为Prometheus1。
1sudo mv /etc/systemd/system/prometheus.service /etc/systemd/system/prometheus1.service
在文本编辑器中打开 Prometheus 服务文件。
1sudo nano /etc/systemd/system/prometheus1.service
您将使用9090的默认端口运行 Prometheus 2.0,因此将 Prometheus 1.8.2 听取的端口更改为9089。
1[label ExecStart - /etc/systemd/system/prometheus.service]
2...
3ExecStart=/usr/local/bin/prometheus1 \
4    -config.file /etc/prometheus1/prometheus.yml \
5    -storage.local.path /var/lib/prometheus1/ \
6    -web.listen-address ":9089"
7...
保存文件并关闭文本编辑器. 重新加载 systemd 以应用更改。
1sudo systemctl daemon-reload
启动Prometheus1服务。
1sudo systemctl start prometheus1
要确保它按预期工作,请检查服务的状态。
1sudo systemctl status prometheus1
与以前一样,输出包含有关流程的信息,如PID、状态等:
 1[secondary_label Service status output]
 2● prometheus1.service - Prometheus
 3   Loaded: loaded (/etc/systemd/system/prometheus1.service; disabled; vendor preset: enabled)
 4   Active: active (running) since Mon 2018-01-01 21:46:42 UTC; 3s ago
 5 Main PID: 1718 (prometheus1)
 6    Tasks: 6
 7   Memory: 35.7M
 8      CPU: 223ms
 9   CGroup: /system.slice/prometheus1.service
10           └─1718 /usr/local/bin/prometheus1 -config.file /etc/prometheus1/prometheus.yml -storage.local.path /var/lib/prometheus1/
11...
如果服务状态不活跃,请遵循屏幕日志并追踪上面的步骤以解决问题,然后继续本教程。
启用该服务,以确保系统启动时启动。
1sudo systemctl enable prometheus1
在这一点上,Prometheus 1.8.2 不会破坏任何出口商,这将确保数据的一致性,一旦我们设置了Prometheus 2.0,它将使用当前的安装作为旧数据的只读数据存储。
步骤 3 – 配置 Prometheus 2.0
在此步骤中,我们将配置 Prometheus 2.0 来扫描出口器,并将 Prometheus 1.8.2 用作只读的数据存储,以便我们可以访问现有数据。
在继续本教程之前,请按照 Ubuntu 16.04 上如何安装 Prometheus 的步骤 1 和 2(https://andsky.com/tech/tutorials/how-to-install-prometheus-on-ubuntu-16-04#step-2-%E2%80%94-downloading-prometheus)的教程来安装 Prometheus 2。
安装 Prometheus 后,创建一个新的配置文件。配置文件格式尚未改变,因此您可以使用 Prometheus 1.x 配置文件与 Prometheus 2 一起使用。
1sudo cp /etc/prometheus1/prometheus.yml.bak /etc/prometheus/prometheus.yml
将新创建的配置文件的用户和组所有权设置为 prometheus用户。
1sudo chown prometheus:prometheus /etc/prometheus/prometheus.yml
您对此文件所做的唯一改变是告诉 Prometheus 2.0 使用 Prometheus 1.8.2 作为仅可读的数据存储,以便您可以访问旧数据。
1sudo nano /etc/prometheus/prometheus.yml
在配置文件的末尾,添加从远程 Prometheus 实例读取的'remote_read' 指令. 让它从你的 Prometheus 1.8.2 实例 'localhst:9089' 读取:
1[label Prometheus configuration file - /etc/prometheus/prometheus.yml]
2...
3
4remote_read:
5    - url: http://localhost:9089/api/v1/read
一旦完成,保存文件并关闭文本编辑器。
在首次运行 Prometheus 2.0 之前,我们将更新警报规则并将 Alertmanager 配置为与 Prometheus 合作。
步骤 4 — 配置警报(可选)
Prometheus 1.x 警报规则是使用自定义语法定义的。从版本 2.0 开始,您使用 YAML 来定义警报规则. 为了使迁移更容易,Prometheus 的promtool命令可以将旧的规则文件转换为新格式。
首先,从 /etc/prometheus1 目录复制到 /etc/prometheus 目录的所有规则。
1sudo cp /etc/prometheus1/*.rules /etc/prometheus/
此外,请通过运行以下命令确保您有promtool版本 2.0:
1promtool --version
输出包含promtool版本和构建信息。
1[secondary_label promtool --version]
2promtool, version 2.0.0 (branch: HEAD, revision: 0a74f98628a0463dddc90528220c94de5032d1a0)
3  build user:       root@615b82cb36b6
4  build date:       20171108-07:11:59
5  go version:       go1.9.2
如果版本不是2.0,请确保您将可执行的promtool复制到正确的位置。
现在,导航到/etc/prometheus目录。
1cd /etc/prometheus
运行下列promtool命令为您在目录中的每个.rules文件:
1sudo promtool update rules file-name.rules
这会从提供的文件中生成一个名为 file-name.rules.yml 的新文件. 如果您在屏幕上看到任何错误消息,请按照屏幕上的日志来解决问题,然后继续教程。
确保用户和组所有权正确设置在由promtool创建的文件上。
1sudo chown prometheus:prometheus file-name.rules
最后,更新 Prometheus 配置文件以使用您新创建的规则文件,而不是旧的规则文件。
1sudo nano /etc/prometheus/prometheus.yml
在rule_files指令下的每个条目中附上.yml字符串,如下:
1...
2rule_files:
3  - alert1.rules.yml
4  - alert2.rules.yml
5...
保存文件并离开编辑器。
现在删除旧警报规则文件,因为它们不再需要。
1sudo rm alert1.rules alert2.rules
接下来,让我们配置 Prometheus 来发现 Alertmanager. 标志-alertmanager.url 不再存在. 相反,Prometheus 2.0 引入了 Alertmanager Service Discovery,这带来了许多新功能和更好的与服务(如 Kubernetes)的集成。
在编辑器中再次打开prometheus.yml文件:
1sudo nano /etc/prometheus/prometheus.yml
以下警告指示 Prometheus 使用在 Droplet 的端口 `:9093’ 上运行的 Alertmanager。
 1[label /etc/prometheus/prometheus.yml]
 2global:
 3...
 4
 5alerting:
 6  alertmanagers:
 7  - static_configs:
 8    - targets:
 9      - alertmanager:9093
10
11rule_files:
12...
保存文件并关闭文本编辑器。
Prometheus 现在可以使用警报规则并与 Alertmanager 进行通信,我们已经准备好首次运行。
第5步:运行Prometheus 2.0
我们可以从我们为 Prometheus 1.8.2 使用的服务文件开始,因为它大多是相同的,而不是ExecStart命令。
创建一个新的服务文件,复制现有文件:
1sudo cp /etc/systemd/system/prometheus1.service /etc/systemd/system/prometheus.service
在您的编辑器中打开新创建的服务文件:
1sudo nano /etc/systemd/system/prometheus.service
Prometheus 2.0 在旗帜系统中带来了几个重要的变化,包括:
- 旗帜现在使用双层(
--)代替单层为前缀。 - 所有
-storage.local和-storage.remote旗帜已被移除,并被--storage.tsdb旗帜取代。
将ExecStart指令替换为下列指令:
1ExecStart=/usr/local/bin/prometheus \
2    --config.file /etc/prometheus/prometheus.yml \
3    --storage.tsdb.path /var/lib/prometheus/ \
4    --web.console.templates=/etc/prometheus/consoles \
5    --web.console.libraries=/etc/prometheus/console_libraries
「--config.file」指示Prometheus在「/etc/prometheus」目錄中使用「prometheus.yml」檔案.而不是「--storage.local.path」,我們會使用「--storage.tsdb.path」。
一旦完成,保存文件并关闭文本编辑器。
最后,重新加载 systemd,这样您就可以使用新创建的服务。
1sudo systemctl daemon-reload
然后开始Prometheus:
1sudo systemctl start prometheus
检查服务的状态,以确保它按预期工作。
1sudo systemctl status prometheus
 1[secondary_label Prometheus service status]
 2● prometheus.service - Prometheus
 3    Loaded: loaded (/etc/systemd/system/prometheus.service; enabled; vendor preset: enabled)
 4    Active: active (running) since Mon 2018-01-01 20:15:09 UTC; 1h 20min ago
 5  Main PID: 1947 (prometheus)
 6    Tasks: 7
 7    Memory: 54.3M
 8      CPU: 15.626s
 9    CGroup: /system.slice/prometheus.service
10            └─1947 /usr/local/bin/prometheus --config.file /etc/prometheus/prometheus.yml --storage.tsdb.path /var/lib/prometheus/
11...
如果服务状态不活跃,请遵循屏幕日志并追踪上面的步骤以解决问题,然后继续本教程。
现在你知道该服务工作了,允许它在系统启动时启动:
1sudo systemctl enable prometheus
您可以通过浏览您的 Web 浏览器中的 http://your_server_ip 来访问 Prometheus 的 Web 用户界面,并使用您在安装 Prometheus 时配置的凭据进行身份验证。
步骤6:测试普罗米修斯
让我们确保 Prometheus 2 按预期扫描所有出口商,并确保它可以访问先前安装 Prometheus 的数据。
在您的 Web 浏览器中导航到http://your_server_ip,以访问 Prometheus Web UI.您将被要求输入您最初安装 Prometheus 时配置的用户名和密码。
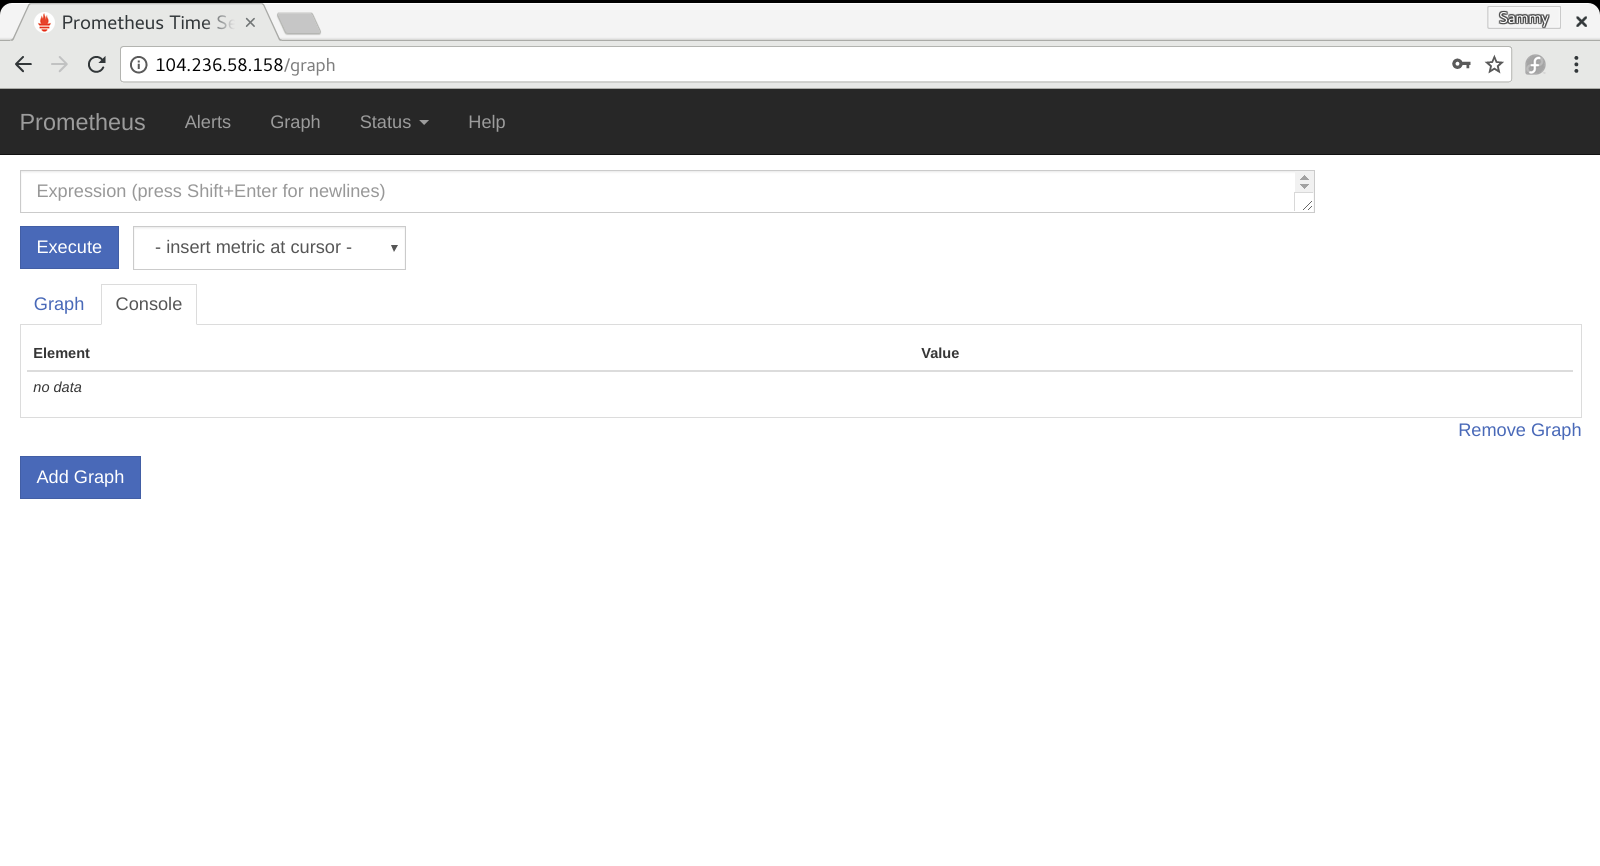
一旦您输入凭证,您将看到 ** 图表** 页面,您可以执行和可视化查询:
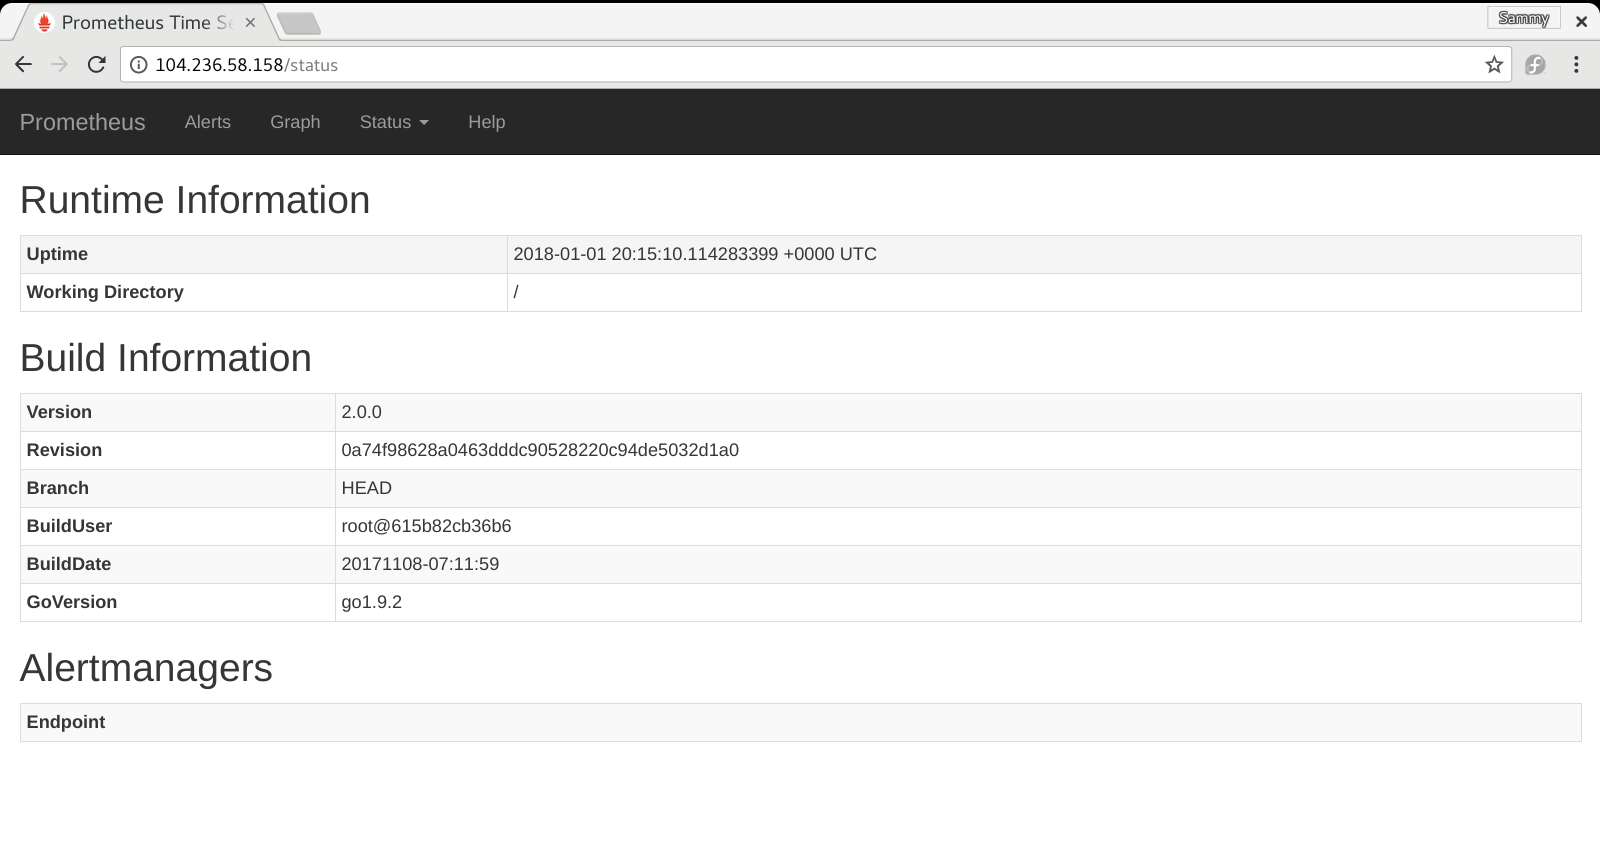
在执行查询之前,让我们检查Prometheus的版本和导出器的状态。在导航栏中点击 状态链接,然后点击 运行时间和构建信息按钮。
接下来,再单击 **状态 ** 链接,然后单击 ** 目标 ** 按钮,以检查您的导出器是否按预期运行。

如果您看到任何错误,请确保通过遵循屏幕上的指示来解决它,然后继续教程。
您不会看到您的 Prometheus 1.8.2 数据源,因为它被用作数据存储器而不是导出器,所以让我们确保我们可以访问旧数据和新数据。
在 Expression字段中,键入 node_memory_MemAvailable/1024/1024 以获取您的服务器可用内存的 Megabyte。
你会看到在屏幕上显示的结果:
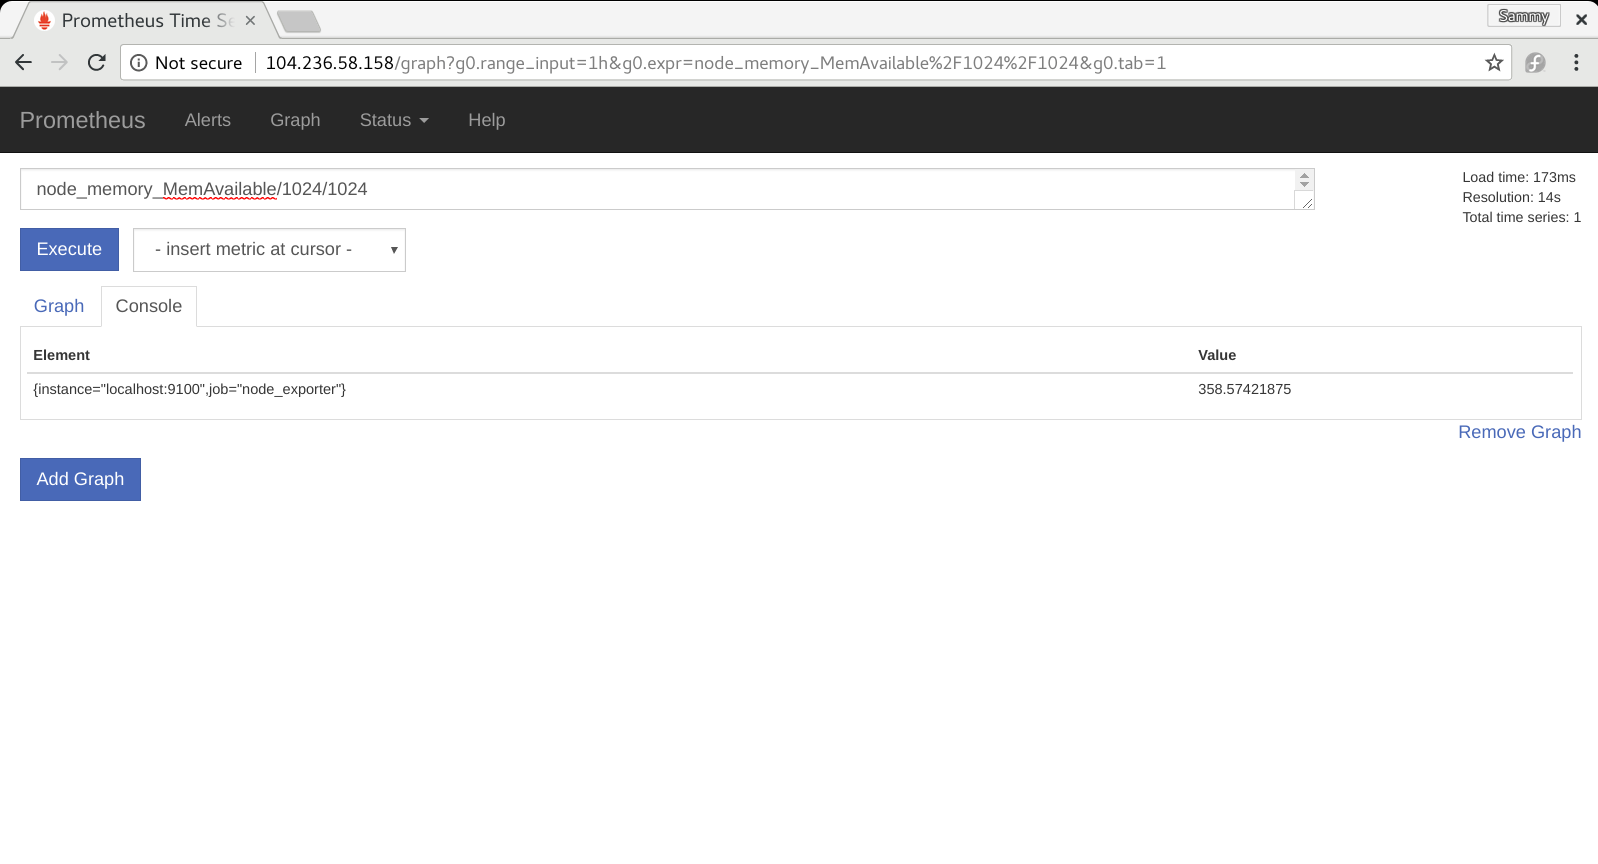
在图表上,你应该看到以前的数据,并且在Prometheus不工作时休息后,最新数据。

如果您看不到旧数据,请通过检查其服务的状态来确保 Prometheus 1.8.2 已启用,并且您已配置 Prometheus 2.0 作为远程数据库。
现在让我们看看如何删除 Prometheus 1.8.2 和旧数据,一旦不再使用。
步骤 7 — 删除旧数据(可选)
您可能想删除 Prometheus 1.8.2 和您的旧数据,一旦您不再需要它。
<$>[警告] **警告:**这是一个不可逆转的操作!一旦删除你的旧数据,你将永远无法恢复它,除非你已经备份它。
首先,从 Prometheus 2 配置文件中删除remote_read指令,在编辑器中打开 Prometheus 2.0 配置文件:
1sudo nano /etc/prometheus/prometheus.yml
查找并删除应该位于文件末尾的remote_read指令:
1remote_read:
2    - url: http://localhost:9089/api/v1/read
保存文件并关闭文本编辑器. 重新启动 Prometheus 以应用更改。
1sudo systemctl restart prometheus
确保服务正常运行:
1sudo systemctl status prometheus
 1[secondary_label Prometheus service status]
 2● prometheus.service - Prometheus
 3   Loaded: loaded (/etc/systemd/system/prometheus.service; enabled; vendor preset: enabled)
 4   Active: active (running) since Mon 2018-01-01 20:15:09 UTC; 1h 20min ago
 5 Main PID: 1947 (prometheus)
 6    Tasks: 7
 7   Memory: 54.3M
 8      CPU: 15.626s
 9   CGroup: /system.slice/prometheus.service
10           └─1947 /usr/local/bin/prometheus --config.file /etc/prometheus/prometheus.yml --storage.tsdb.path /var/lib/prometheus/
11...
如果服务状态不活跃,请遵循屏幕日志并追踪上面的步骤以解决问题,然后继续本教程。
接下来,禁用并删除prometheus1服务,然后清除所有 Prometheus 1.8.2 相关目录和文件。
禁用该服务,以确保它不会自动启动:
1sudo systemctl disable prometheus1
然后停止服务:
1sudo systemctl stop prometheus1
没有结果表明操作成功完成。
现在删除prometheus1服务文件:
1sudo rm /etc/systemd/system/prometheus1.service
最后,删除剩余的文件,因为它们不再需要。 首先,删除位于 /usr/local/bin’ 目录中的 prometheus1和promtool1` 执行。
1sudo rm /usr/local/bin/prometheus1 /usr/local/bin/promtool1
然后删除用于存储数据和配置的 /etc/prometheus1 和 /var/lib/prometheus1 目录。
1sudo rm -r /etc/prometheus1 /var/lib/prometheus1
Prometheus 1.8.2 已从您的系统中删除,您的旧数据已经消失了。
结论
在本教程中,您升级了 Prometheus 1.x 到 Prometheus 2.0,更新了所有规则文件,并配置了 Prometheus 以发现 Alertmanager 是否存在。
了解有关 Prometheus 2.0 所包含的所有更改的更多信息,请阅读官方 公告 Prometheus 2.0 邮件和 项目的更改日志 。