Step 1 - Setup A Monitoring Server
Spin up a CentOS 6.3 x64 droplet that will be used to connect to all your other servers.
For our example, this monitoring server's IP is 198.211.117.251. All the future config snippets will reference this IP, so make sure to change it to your own value.
Step 2 - Install Packages on Hosts to be Monitored
yum -y install net-snmp && chkconfig snmpd on && :> /etc/snmp/snmpd.conf
Add the following lines to /etc/snmp/snmpd.conf:
com2sec mynetwork 198.211.117.251 DigitalOcean
group MyROGroup v1 mynetwork
view all included .1 80
access MyROGroup ""      any noauth exact all none none
Our client servers are cloudmail.tk (198.211.107.218) and emailocean.tk (198.211.112.99).
If you have firewall rules on your servers, make sure to allow UDP connections to port 161 from your monitoring droplet, and drop everyone else:
iptables -I INPUT -s 198.211.117.251 -p udp --dport 161 -j ACCEPT
iptables -A INPUT -s 0/0 -p udp --dport 161 -j DROP
Now you can start SNMP daemon on all of your servers that you wish to monitor:
service snmpd start
Step 3 - Configure Monitoring Server
yum -y install net-snmp-utils rrdtool httpd && chkconfig httpd on
Create RRD database files for each client. You only need to run this once:
rrdtool create /root/cloudmail.tk.rrd -s 60 DS:in:COUNTER:300:U:U DS:out:COUNTER:300:U:U RRA:AVERAGE:0.5:1:10080
rrdtool create /root/emailocean.tk.rrd -s 60 DS:in:COUNTER:300:U:U DS:out:COUNTER:300:U:U RRA:AVERAGE:0.5:1:10080
Create a script that would update your graphs. The first set of commands creates and updates the data file, while second one plots this data into a PNG file that will be saved into Apache's DocumentRoot path.
Save this file as /root/rrdupdate.sh and make sure you do not have any spaces after '\' since this is all a single line that was broken into multiple:
# !/bin/bash
rrdupdate /root/cloudmail.tk.rrd N:`snmpget -v 1 -c DigitalOcean -Oqv 198.211.107.218 \
IF-MIB::ifInOctets.1`:`snmpget -v 1 -c DigitalOcean -Oqv 198.211.107.218 IF-MIB::ifOutOctets.1`

rrdtool graph /var/www/html/cloudmail.tk.png \
-a PNG -h 125 -s -43200 --title "cloudmail.tk (198.211.107.218)" \
-v "Data Throughput" \
'DEF:in=/root/cloudmail.tk.rrd:in:AVERAGE' \
'DEF:out=/root/cloudmail.tk.rrd:out:AVERAGE' \
'CDEF:kbin=in,1024,/' \
'CDEF:kbout=out,1024,/' \
'AREA:in#00FF00:Bandwidth In' \
'LINE1:out#0000FF:Bandwidth Out\j' \
'GPRINT:kbin:LAST:Last Bandwidth In\:    %3.2lf KBps' \
'GPRINT:kbout:LAST:Last Bandwidth Out\:   %3.2lf KBps\j' \
'GPRINT:kbin:AVERAGE:Average Bandwidth In\: %3.2lf KBps' \
'GPRINT:kbout:AVERAGE:Average Bandwidth Out\:%3.2lf KBps\j'

rrdupdate /root/emailocean.tk.rrd N:`snmpget -v 1 -c DigitalOcean -Oqv 198.211.112.99 \
IF-MIB::ifInOctets.1`:`snmpget -v 1 -c DigitalOcean -Oqv 198.211.112.99 IF-MIB::ifOutOctets.1`

rrdtool graph /var/www/html/emailocean.tk.png \
-a PNG -h 125 -s -43200 --title "emailocean.tk (198.211.112.99)" \
-v "Data Throughput" \
'DEF:in=/root/emailocean.tk.rrd:in:AVERAGE' \
'DEF:out=/root/emailocean.tk.rrd:out:AVERAGE' \
'CDEF:kbin=in,1024,/' \
'CDEF:kbout=out,1024,/' \
'AREA:in#00FF00:Bandwidth In' \
'LINE1:out#0000FF:Bandwidth Out\j' \
'GPRINT:kbin:LAST:Last Bandwidth In\:    %3.2lf KBps' \
'GPRINT:kbout:LAST:Last Bandwidth Out\:   %3.2lf KBps\j' \
'GPRINT:kbin:AVERAGE:Average Bandwidth In\: %3.2lf KBps' \
'GPRINT:kbout:AVERAGE:Average Bandwidth Out\:%3.2lf KBps\j'
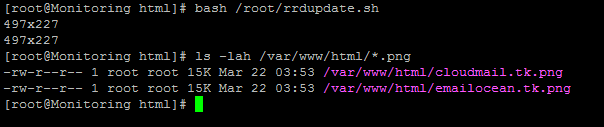
Run your script to make sure there are no errors and that graphs are generated:
bash /root/rrdupdate.sh
ls -lah /var/www/html/*.png
Now just add a crontab entry that would update the graphs every 5 minutes, and start Apache
echo "*/5 * * * * bash /root/rrdupdate.sh" > /var/spool/cron/root
service httpd start
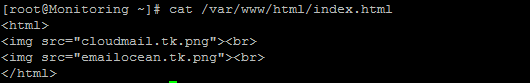
You can include those graphs into your own website, or add a new /var/www/html/index.html
Allow the data to be populated for a few hours and navigate over to your monitoring droplet's IP address:
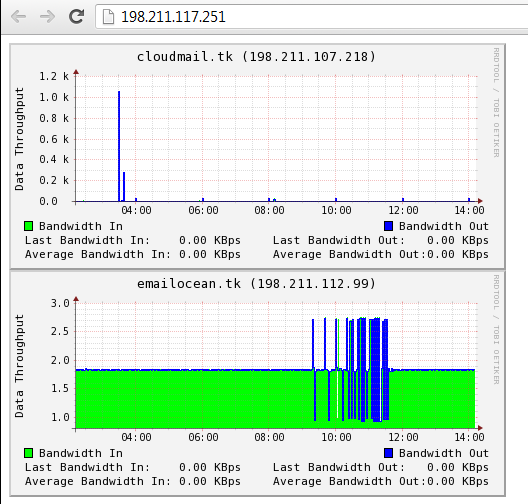
And you are all done!