介绍
Alerta是一个用于将多个监控系统的警报合并和解复制并在单个屏幕上可视化的Web应用程序,Alerta可以与许多已知的监控工具集成,如Nagios,Zabbix,Sensu,InfluxData Kapacitor等。
在本教程中,您将设置 Alerta 并配置它以显示来自 Nagios的通知,这是流行的开源监控系统。
前提条件
要遵循本教程,您将需要:
在第一個 CentOS 伺服器上,那裡你會執行 Nagios,安裝下列組成部分: 如何安裝 Nagios 4 和監控你的伺服器在 CentOS 7 上(How To Install Linux, MySQL, MySQL, PHP (LAMP) Stack On CentOS 7)(https://andsky.com/tech/tutorials/how-to-install-linux-apache-mysql-php-lamp-stack-on-centos-7)。
- Nagios 4,安裝下面的教程: 如何安裝 Nagios 4 和監控你的伺服器在 CentOS 7 上(How To Install Nagios 4 and Monitor Your Servers on CentOS 7)(LINK2)) 和其設定條件教程。
步骤 1 — 安装 Nagios-to-Alerta 事件经纪人模块
您可以通过 Nagios Event Broker (NEB) 模块来扩展 Nagios 的功能,NEB 是 Nagios 的事件集成机制,NEB 模块是共享库,允许您与 Nagios 集成其他服务。
登录您的 Nagios 服务器,作为您的非根用户:
1[environment local]
2ssh sammy@your_nagios_server_ip
Nagios to Alerta Gateway 没有预先配置的系统包,所以你必须从源头构建它. 要做到这一点,你需要安装一些开发工具和文件. 你还需要安装 Git,这样你就可以从 GitHub 获取源代码。
1sudo yum install -y git curl gcc make libcurl-devel
安装前提条件后,使用 Git 从项目的 GitHub 存储库克隆源代码:
1git clone https://github.com/alerta/nagios-alerta.git
然后更改到新的nagios-alerta目录:
1cd nagios-alerta
然后使用make编译nagios-alerta模块:
1make nagios4
您将看到以下输出:
1[secondary_label Output]
2cd ./src && make nagios4
3make[1]: Entering directory `/root/nagios-alerta/src'
4gcc -fPIC -g -O2 -DHAVE_CONFIG_H -I../include -I../include/nagios4 -lcurl -o alerta-neb.o alerta-neb.c -shared  -lcurl
5make[1]: Leaving directory `/root/nagios-alerta/src'
如果您看到不同的东西,请确保您安装了所有前提条件。
现在运行安装任务:
1sudo make install
您将看到此输出,表示模块已安装在 /usr/lib/nagios 中:
1[secondary_label Output]
2cd ./src && make install
3make[1]: Entering directory `/root/nagios-alerta/src'
4[ -d /usr/lib/nagios ] || mkdir /usr/lib/nagios
5install -m 0644 alerta-neb.o /usr/lib/nagios
6make[1]: Leaving directory `/root/nagios-alerta/src'
安装该模块后,我们可以配置Nagios以使用该新模块。
步骤 2 — 配置 Nagios-to-Alerta 模块
让我们将 Nagios 配置为向 Alerta 发送通知消息。
首先,在 Nagios 主配置文件中启用新安装的 Alerta 经纪模块。
1sudo vi /usr/local/nagios/etc/nagios.cfg
查找包含broker_module指令的部分:
 1[label /usr/local/nagios/etc/nagios.cfg]
 2...
 3# EVENT BROKER MODULE(S)
 4# This directive is used to specify an event broker module that should
 5# by loaded by Nagios at startup. Use multiple directives if you want
 6# to load more than one module. Arguments that should be passed to
 7# the module at startup are separated from the module path by a space.
 8#
 9[...]
10#broker_module=/somewhere/module1.o
11#broker_module=/somewhere/module2.o arg1 arg2=3 debug=0
12...
要配置 Alerta 模块,您需要提供两个强制性的参数:
- URL: 用于与 Alerta API 通信的地址. 您在教程 如何在 CentOS 7 上使用 Alerta 监控 Zabbix 警报第 3 步设置了此设置。
- key: 您在教程 如何在 CentOS 7 上使用 Alerta 监控 Zabbix 警报第 4 步创建的 API 密钥。
将此行添加到文件中以配置 Alerta 集成:
1[label /usr/local/nagios/etc/nagios.cfg]
2...
3broker_module=/usr/lib/nagios/alerta-neb.o http://your_alerta_server_ip/api key=ALERTA_API_KEY
4...
您也可以指定一些额外的可选参数:
- env:此指示环境名称。默认环境名称为
生产。 - hard_only: Forwards 结果只有硬状态。 您可以找到有关 Nagios 状态类型的更多信息(在 Nagios 文档中)。 将此设置为
1以启用此模式。 - debug: - 启用模块的调试模式。 将此设置为
1以启用此模式。
若要指定所有这些选项,请使用此行代替:
1[label /usr/local/nagios/etc/nagios.cfg]
2...
3broker_module=/usr/lib/nagios/alerta-neb.o http://your_alerta_server_ip/api key=ALERTA_API_KEY env=Production hard_only=1 debug=1
4...
保存文件并离开编辑器。
为了根据环境和服务名称识别警报,您需要使用 Nagios Custom Object Variables设置环境和服务名称。
打开默认的 Nagios 主机对象配置文件,您可以在 /usr/local/nagios/etc/objects/ 目录中找到:
1sudo vi /usr/local/nagios/etc/objects/localhost.cfg
我们将将此主机的所有警报标记为 ** 生产 ** 警报,并将默认服务称为 ** Nagios**。
 1[label /usr/local/nagios/etc/objects/localhost.cfg]
 2...
 3define host{
 4        use linux-server            ; Name of host template to use
 5                                                        ; This host definition will inherit all variables that are defined
 6                                                        ; in (or inherited by) the linux-server host template definition.
 7        host_name localhost
 8        alias localhost
 9        address 127.0.0.1
10        }
11
12...
将_环境和_服务值添加到配置中:
1[label /usr/local/nagios/etc/objects/localhost.cfg]
2...
3        host_name localhost
4        alias localhost
5        address 127.0.0.1
6        _Environment Production
7        _Service Nagios
8        }
9...
现在,将与系统分区缺少空间相关的所有事件标记为 System警报。
1[label /usr/local/nagios/etc/objects/localhost.cfg]
2...
3define service{
4        use local-service         ; Name of service template to use
5        host_name localhost
6        service_description Root Partition
7        check_command check_local_disk!20%!10%!/
8        }
9...
修改它以将其与系统服务相关联:
 1[label /usr/local/nagios/etc/objects/localhost.cfg]
 2...
 3define service{
 4        use local-service         ; Name of service template to use
 5        host_name localhost
 6        service_description Root Partition
 7        check_command check_local_disk!20%!10%!/
 8        _Service System
 9        }
10...
保存文件并离开编辑器. 重新启动 Nagios 以应用这些新设置:
1sudo systemctl restart nagios.service
通过检查其状态来确保服务运行:
1systemctl status nagios.service
您将看到以下输出:
1[secondary_label Output]
2...
3Jul 01 08:44:31 nagios nagios[8914]: [alerta] Initialising Nagios-Alerta Gateway module, v3.4.1
4Jul 01 08:44:31 nagios nagios[8914]: [alerta] debug is off
5Jul 01 08:44:31 nagios nagios[8914]: [alerta] states=Hard/Soft
6Jul 01 08:44:31 nagios nagios[8914]: [alerta] Forward service checks, host checks and downtime to http://your_alerta_server_ip/api
7Jul 01 08:44:31 nagios nagios[8914]: Event broker module '/usr/lib/nagios/alerta-neb.o' initialized successfully.
8Jul 01 08:44:31 nagios nagios[8914]: Successfully launched command file worker with pid 8920
现在,Nagios将在任何系统或服务关闭时发送通知,让我们生成一个测试事件。
步骤 3 – 生成测试警报以验证 Nagios-Alerta 集成
让我们生成一个测试警报,以确保一切都连接起来. 默认情况下,Nagios 会跟踪您服务器上空缺的磁盘空间。
首先,确定您在Nagios服务器上有多少可用空间,您可以使用df命令来查找:
1df -h
你会看到输出如下:
1[secondary_label Output]
2    Filesystem Size Used Avail Use% Mounted on
3    /dev/vda1 20G 3.1G 16G 17% /
查看可用空间的数量 在这种情况下,可用的空间为16GB。
使用fallocate命令创建一个占用可用磁盘空间的文件,这应该足以触发警报:
1fallocate -l 14G /tmp/temp.img
在几分钟内,Nagios会发出关于空白磁盘空间的警报,并将通知消息发送到Alerta。
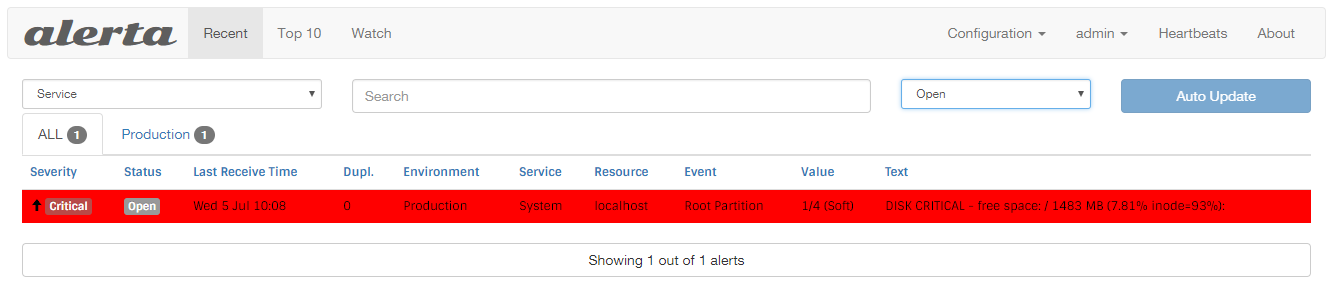
现在你知道警报正在工作,删除你创建的临时文件,这样你就可以恢复你的磁盘空间:
1rm -f /tmp/temp.img
一分钟后,Nagios将发送恢复消息,然后警报将从主要Alerta仪表板中消失,但您可以通过选择 Closed来查看所有已关闭的事件。
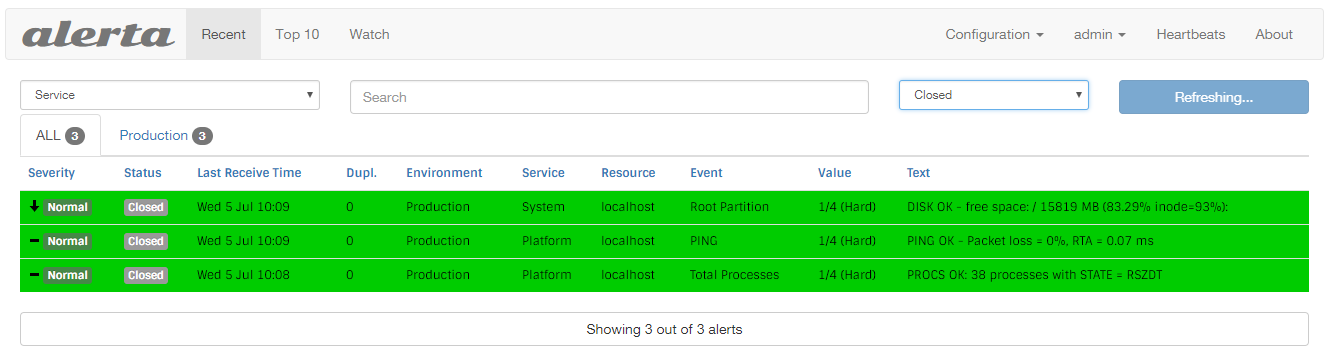
您可以点击事件行查看更多细节。
结论
在本教程中,您将 Nagios 配置为向运行 Alerta 的另一个服务器发送通知。
例如,如果您的基础设施的一些部分使用Nagios,而其他部分使用Zabbix,则可以将两种系统的通知合并成一个面板。