作者选择了 COVID-19 救援基金作为 Write for Donations计划的一部分接受捐款。
介绍
对于数据库管理员来说,避免性能或内存问题至关重要。 诸如 Prometheus 和 Grafana 等工具可以帮助您监控数据库集群性能。 Prometheus 是一个开源监控和警报平台,在 time-series 数据中收集和存储指标。 Grafana 是一个交互式可视化和分析的开源 Web 应用程序。 它允许您从众多数据源中输入数据,查询这些数据,并在可自定义图表上显示它们,以便轻松进行分析。 还可以设置警报,以便您可以快速轻松地收到意外行为的通知。 使用它们一起,您可以从您的 MDBongo 实例中收集
在本教程中,您将设置一个MongoDB数据库,并使用Grafana使用Prometheus作为数据源监控它. 要做到这一点,您将配置MongoDB导出器作为Prometheus目标,以便Prometheus可以扫描您的数据库指标并使其可用于Grafana。
前提条件
要遵循本教程,您将需要:
- 一个 Ubuntu 20.04 服务器具有非 root 用户的
sudo特权和与ufw配置的防火墙,您可以通过遵循 Ubuntu 20.04 初始服务器设置指南来做。 - MongoDB 安装在 Ubuntu 20.04 服务器上,您可以通过遵循教程来做, 如何在 Ubuntu 20.04 上安装 MongoDB。
要安装 Grafana,您将需要以下内容:
您可以在 Namecheap购买域名,在 Freenom免费获得一个域名,或者使用您选择的域名注册器。
- 以下 DNS 记录为您的服务器设置。 您可以遵循 How To Add Domains的文章以获取如何添加它们的详细信息,如果您正在使用 DigitalOcean。
- 一个 A记录与
your_domain指向您的服务器的公共 IP 地址。 - 一个 A记录与
www.your_domain指向您的服务器的公共 IP 地址。
- Nginx设置由以下的 [How To Install Nginx on Ubuntu 20.0
步骤 1 – 安装和配置 Prometheus
Prometheus 是一个开源系统监控和警报工具包,收集和存储指标作为时间序列数据,即指标信息与记录的时间标签一起存储。
安装 Prometheus
首先,您需要安装 Prometheus. 首先,您需要登录您的服务器并如下更新包列表:
1sudo apt update
接下来,您将为 Prometheus 创建配置和数据目录. 若要创建名为prometheus的配置目录,请运行以下命令:
1sudo mkdir -p /etc/prometheus
接下来,创建数据目录:
1sudo mkdir -p /var/lib/prometheus
创建目录后,您将下载压缩的安装文件. Prometheus 安装文件以压缩文件的预编译二进制形式。 要下载 Prometheus,请访问 下载页面。
要下载版本 2.31.0,请执行以下命令,根据需要更换版本号:
1wget https://github.com/prometheus/prometheus/releases/download/v2.31.0/prometheus-2.31.0.linux-amd64.tar.gz
一旦下载,提取 tarball 文件:
1tar -xvf prometheus-2.31.0.linux-amd64.tar.gz
提取文件后,导航到 Prometheus 文件夹:
1cd prometheus-2.31.0.linux-amd64
然后,将promtool和prometheus二进制文件移动到/usr/local/bin/目录:
1sudo mv prometheus promtool /usr/local/bin/
接下来,将所有与 Prometheus 相关的文件移动到一个位置: /etc/prometheus/. 若要将控制台文件移动到consoles目录和console_libraries目录中的库文件,请执行以下命令:
1sudo mv consoles/ console_libraries/ /etc/prometheus/
使用控制台和控制台库文件启动 Prometheus GUI. 这些文件将保存在配置文件中,以便在启动服务时使用。
最后,将prometheus.yml模板配置文件移动到/etc/prometheus/目录:
1sudo mv prometheus.yml /etc/prometheus/prometheus.yml
prometheus.yml 是 模板配置文件中,您将配置 Prometheus 端口以及在启动服务时使用哪些文件。
要检查安装的 Prometheus 版本,请运行命令:
1prometheus --version
您将收到类似于此的输出:
1[secondary_label Output]
2prometheus, version 2.31.0 (branch: HEAD, revision: b41e0750abf5cc18d8233161560731de05199330)
3  build user:       root@0aa1b7fc430d
4  build date:       20220714-15:13:18
5  go version:       go1.18.4
6  platform:         linux/amd64
在本节中,您安装了 Prometheus 并验证了其版本,接下来,您将将其作为服务启动。
运行 Prometheus 作为一个服务
现在你已经安装了 Prometheus,你将配置它作为一个服务运行。
在创建系统文件之前,您需要创建一个 Prometheus 组和用户,您需要一个拥有所有者访问所需的目录的专用用户。
1sudo groupadd --system prometheus
接下来,创建一个Prometheus用户,并将其分配给您刚刚创建的Prometheus组:
1sudo useradd -s /sbin/nologin --system -g prometheus prometheus
如下,更改目录所有权和权限,以便专用用户具有正确的权限:
1sudo chown -R prometheus:prometheus /etc/prometheus/ /var/lib/prometheus/
2sudo chmod -R 775 /etc/prometheus/ /var/lib/prometheus/
接下来,您将创建服务文件以运行 Prometheus 作为服务. 使用nano或您最喜欢的文本编辑器,创建一个名为prometheus.service的systemd服务文件:
1sudo nano /etc/systemd/system/prometheus.service
添加以下代码行:
 1[label /etc/systemd/system/prometheus.service]
 2[Unit]
 3Description=Prometheus
 4Wants=network-online.target
 5After=network-online.target
 6
 7[Service]
 8User=prometheus
 9Group=prometheus
10Restart=always
11Type=simple
12ExecStart=/usr/local/bin/prometheus \
13    --config.file=/etc/prometheus/prometheus.yml \
14    --storage.tsdb.path=/var/lib/prometheus/ \
15    --web.console.templates=/etc/prometheus/consoles \
16    --web.console.libraries=/etc/prometheus/console_libraries \
17    --web.listen-address=0.0.0.0:9090
18
19[Install]
20WantedBy=multi-user.target
使用此代码,您将 Prometheus 配置为使用ExecStart区块中列出的文件来运行服务。服务文件告诉systemd将 Prometheus 运行为prometheus用户,配置文件为/etc/prometheus/prometheus.yml,并将其数据存储在/var/lib/prometheus目录中。您还会将 Prometheus 配置为在端口9090上运行。
保存并关闭您的文件 如果使用nano,请按CTRL+X,然后按Y。
现在,开始 Prometheus 服务:
1sudo systemctl start prometheus
允许 Prometheus 服务在启动时运行:
1sudo systemctl enable prometheus
您可以使用以下命令检查服务状态:
1sudo systemctl status prometheus
输出将确认服务是活跃(运行):
1[label Output]
2● prometheus.service - Prometheus
3     Loaded: loaded (/etc/systemd/system/prometheus.service; enabled; vendor preset: enabled)
4     Active: active (running) since Fri 2022-08-05 18:06:05 UTC; 13s ago
5   Main PID: 7177 (prometheus)
6      Tasks: 6 (limit: 527)
7     Memory: 21.0M
8     CGroup: /system.slice/prometheus.service
9             └─7177 /usr/local/bin/prometheus --config.file=/etc/prometheus/prometheus.yml --storage.tsdb.path=/var/lib/prometheus/ --web.console.template>
要访问 Prometheus,请启动您的浏览器并访问您的服务器的 IP 地址,然后是端口 9090: http://your_server_ip:9090。
<$>[注]
注: 若要访问 Prometheus Web 主机,您可能需要在服务器上允许端口 9090。
1sudo ufw status
如果9090端口尚未启用,则可以使用以下命令添加它:
1sudo ufw allow 9090
美元
您现在可以访问 Prometheus Web 控制台:
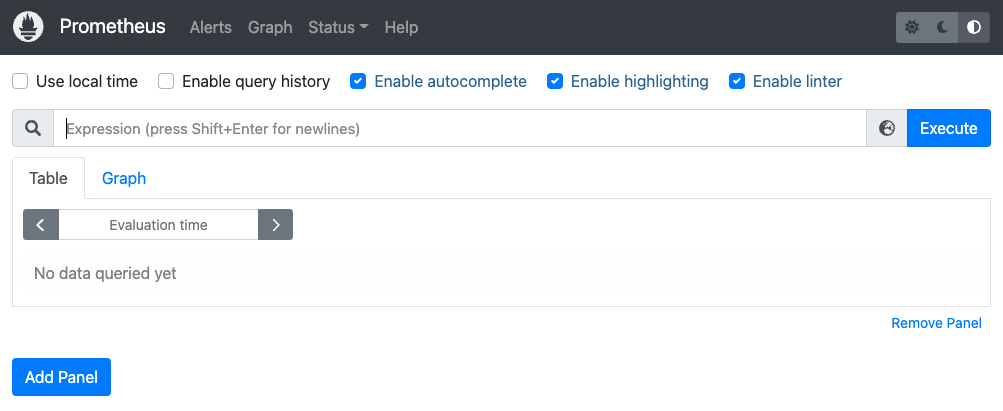
在此步骤中,您安装了 Prometheus,并将其配置为作为服务运行,接下来,您将使用 MongoDB 导出器将您的 MongoDB 数据库连接到 Prometheus。
步骤 2 – 配置 MongoDB 导出器
在此步骤中,您将安装 MongoDB 导出器并将其配置为 Prometheus 目标,以便 Prometheus 可以从您的 MongoDB 实例中收集数据。
安装 MongoDB 导出器
在本节中,您将安装 MongoDB 导出器。
1mkdir mongodb-exporter
2cd mongodb-exporter
MongoDB 导出器可以 从 Github 下载。导出器在档案中作为二进制文件,但你会将其配置为服务。
1wget https://github.com/percona/mongodb_exporter/releases/download/v0.7.1/mongodb_exporter-0.7.1.linux-amd64.tar.gz
接下来,将下载的档案提取到当前文件夹中:
1tar xvzf mongodb_exporter-0.7.1.linux-amd64.tar.gz
最后,将mongodb_exporter二进制移动到usr/local/bin/:
1sudo mv mongodb_exporter /usr/local/bin/
在本节中,您安装了 MongoDB 导出器,接下来,您将启用 MongoDB 身份验证并创建一个用于监控的用户。
支持 MongoDB 身份验证
在本节中,您将为 MongoDB 导出器设置 MongoDB 身份验证,并创建一个用户来监控集群的指标。
首先,用mongo连接到您的 MongoDB 实例:
1mongo
您将为您的出口商创建一个管理员帐户,使用群集监视器的角色。
1use admin
在切换到admin数据库后,创建具有clusterMonitor角色的用户:
1db.createUser({user: "test",pwd: "testing",roles: [{ role: "clusterMonitor", db: "admin" },{ role: "read", db: "local" }]})
您将收到以下输出:
 1Successfully added user: {
 2        "user" : "test",
 3        "roles" : [
 4                {
 5                        "role" : "clusterMonitor",
 6                        "db" : "admin"
 7                },
 8                {
 9                        "role" : "read",
10                        "db" : "local"
11                }
12        ]
13}
创建用户后,退出 MongoDB 壳:
1exit
接下来,设置您的 MongoDB URI 环境变量,使用相应的身份验证凭证:
1export MONGODB_URI=mongodb://test:testing@localhost:27017
您将MONGODB_URI设置为指定使用您先前设置的身份验证凭据(测试用户和测试密码)的mongodb实例。
若要检查 MongoDO URI 环境变量是否正确设置,请执行以下命令:
1env | grep mongodb
您将收到以下输出:
1MONGODB_URI=mongodb://mongodb_exporter:password@localhost:27017
在本节中,您创建了一个 MongoDB 用户,其角色是clusterMonitor,这有助于监控集群指标。
创建 MongoDB 出口器的服务
在本节中,您将为 MongoDB 导出器创建一个系统文件,并将其作为服务运行。
导航到/lib/systemd/system并使用nano或您最喜欢的文本编辑器为导出器创建一个新的服务文件:
1cd /lib/systemd/system/
2sudo nano mongodb_exporter.service
将以下配置粘贴到您的服务文件中:
 1[label /lib/systemd/system/mongodb_exporter.service]
 2[Unit]
 3Description=MongoDB Exporter
 4User=prometheus
 5
 6[Service]
 7Type=simple
 8Restart=always
 9ExecStart=/usr/local/bin/mongodb_exporter
10
11[Install]
12WantedBy=multi-user.target
此服务文件告诉systemd在prometheus用户下运行 MongoDB 导出器作为服务。ExecStart将从usr/local/bin/运行mongodb_exporter二进制。
保存并关闭您的文件。
接下来,重新启动您的系统戴蒙来重新加载单元文件:
1sudo systemctl daemon-reload
现在,开始你的服务:
1sudo systemctl start mongodb_exporter.service
若要检查 MongoDB 导出服务的状态,请运行以下命令:
1sudo systemctl status mongodb_exporter.service
输出将确认服务是活跃(运行):
1[label Output]
2● mongodb_exporter.service - MongoDB Exporter
3     Loaded: loaded (/lib/systemd/system/mongodb_exporter.service; disabled; vendor preset: enabled)
4     Active: active (running) since Fri 2022-08-05 18:18:38 UTC; 1 weeks 3 days ago
5   Main PID: 7352 (mongodb_exporte)
6      Tasks: 5 (limit: 527)
7     Memory: 14.2M
8     CGroup: /system.slice/mongodb_exporter.service
9             └─7352 /usr/local/bin/mongodb_exporter
要确保一切按预期运行,请导航到项目根,并在端口 9216 上运行弯曲命令,即导出器运行的地方:
1cd ~
2sudo curl http://localhost:9216/metrics
输出将很长,并将包含类似于此的行:
 1[secondary_label Output]
 2# HELP go_gc_duration_seconds A summary of the GC invocation durations.
 3# TYPE go_gc_duration_seconds summary
 4go_gc_duration_seconds{quantile="0"} 0
 5go_gc_duration_seconds{quantile="0.25"} 0
 6go_gc_duration_seconds{quantile="0.5"} 0
 7go_gc_duration_seconds{quantile="0.75"} 0
 8go_gc_duration_seconds{quantile="1"} 0
 9go_gc_duration_seconds_sum 0
10go_gc_duration_seconds_count 0
11# HELP go_goroutines Number of goroutines that currently exist.
12# TYPE go_goroutines gauge
13go_goroutines 11
14# HELP go_memstats_alloc_bytes Number of bytes allocated and still in use.
15# TYPE go_memstats_alloc_bytes gauge
16go_memstats_alloc_bytes 1.253696e+06
17# HELP go_memstats_alloc_bytes_total Total number of bytes allocated, even if freed.
18# TYPE go_memstats_alloc_bytes_total counter
19go_memstats_alloc_bytes_total 1.253696e+06
20# HELP go_memstats_buck_hash_sys_bytes Number of bytes used by the profiling bucket hash table.
21# TYPE go_memstats_buck_hash_sys_bytes gauge
22go_memstats_buck_hash_sys_bytes 3054
23# HELP go_memstats_frees_total Total number of frees.
24# TYPE go_memstats_frees_total counter
25go_memstats_frees_total 2866
26# HELP go_memstats_gc_sys_byte
27.
28.
29.
30# HELP mongodb_asserts_total The asserts document reports the number of asserts on the database. While assert errors are typically uncommon, if there are non-zero values for the asserts, you should check the log file for the mongod process for more information. In many cases these errors are trivial, but are worth investigating.
31# TYPE mongodb_asserts_total counter
32mongodb_asserts_total{type="msg"} 0
33mongodb_asserts_total{type="regular"} 0
34mongodb_asserts_total{type="rollovers"} 0
35mongodb_asserts_total{type="user"} 19
36mongodb_asserts_total{type="warning"} 0
37# HELP mongodb_connections The connections sub document data regarding the current status of incoming connections and availability of the database server. Use these values to assess the current load and capacity requirements of the server
38# TYPE mongodb_connections gauge
39mongodb_connections{state="available"} 51198
40mongodb_connections{state="current"} 2
41# HELP mongodb_connections_metrics_created_total totalCreated provides a count of all incoming connections created to the server. This number includes connections that have since closed
42# TYPE mongodb_connections_metrics_created_total counter
43mongodb_connections_metrics_created_total 6
44# HELP mongodb_exporter_build_info A metric with a constant '1' value labeled by version, revision, branch, and goversion from which mongodb_exporter was built.
45# TYPE mongodb_exporter_build_info gauge
46mongodb_exporter_build_info{branch="v0.7.1",goversion="go1.11.10",revision="3002738d50f689c8204f70f6cceb8150b98fa869",version="0.7.1"} 1
47# HELP mongodb_exporter_last_scrape_duration_seconds Duration of the last scrape of metrics from MongoDB.
48# TYPE mongodb_exporter_last_scrape_duration_seconds gauge
49mongodb_exporter_last_scrape_duration_seconds 0.003641888
50# HELP mongodb_exporter_last_scrape_error Whether the last scrape of metrics from MongoDB resulted in an error (1 for error, 0 for success).
51# TYPE mongodb_exporter_last_scrape_error gauge
52mongodb_exporter_last_scrape_error 0
53.
54.
55.
56...
输出确认 MongoDB 导出器正在收集指标,例如mongodb版本、metrics-document和连接细节。
在本节中,您将 MongoDB 导出器设置为服务,并从 MongoDB 收集指标,然后将导出器配置为 Prometheus 的目标。
将 MongoDB 导出器配置为 Prometheus 目标
在本节中,您将将 MongoDB 导出器配置为 Prometheus 目标. 导航到包含您的 Prometheus 配置文件的目录:
1cd /etc/prometheus/
使用nano或您最喜欢的文本编辑器,打开文件进行编辑:
1sudo nano prometheus.yml
将 MongoDB 导出器添加为目标,将突出的行复制到您的文件中:
1[label /etc/prometheus/prometheus.yml]
2# A scrape configuration containing exactly one endpoint to scrape:
3# Here it's Prometheus itself.
4scrape_configs:
5  # The job name is added as a label `job=<job_name>` to any timeseries scraped from this config.
6  - job_name: "prometheus"
7    static_configs:
8            - targets: ["localhost:9090", "localhost:9216"]
「9216」是 MongoDB 出口器的默认端口。
保存并关闭您的文件。
添加目标后,重新启动 Prometheus:
1sudo systemctl restart prometheus
点击http://localhost:9090/targets,确认 Prometheus正在扫描新增的出口商。
<$>[注]
注: 如果您正在使用远程服务器,您可以通过导航到 http://your_server_ip:9090/targets 查看目标,您也可以使用端口转发来本地查看目标。
1ssh -L 9090:localhost:9090 your_non_root_user@your_server_ip
当您连接到服务器时,请在本地计算机的Web浏览器上导航到http://localhost:9090/targets。
您将访问 Prometheus 目标列表:
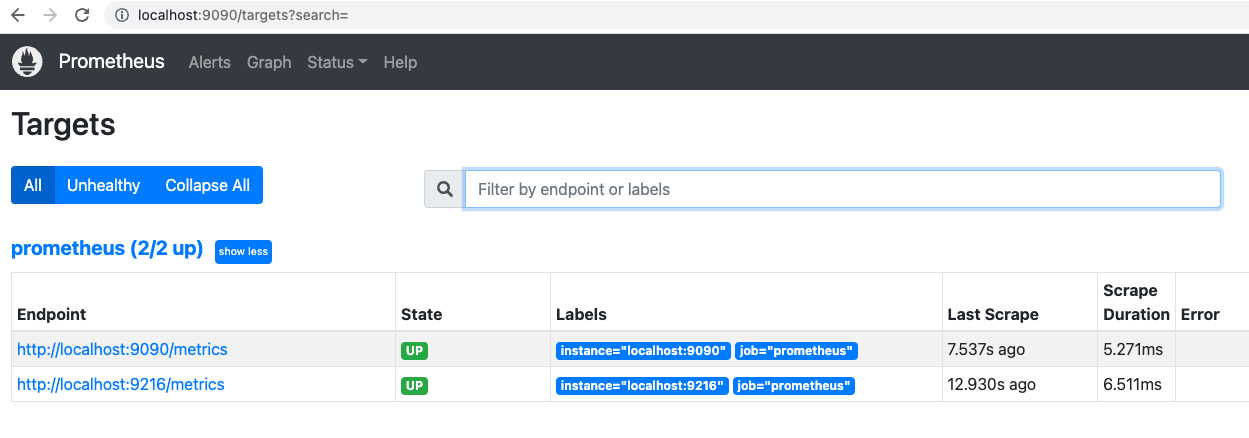
9090终端是Prometheus自己扫描的终端。 9216终端是MongoDB导出器,这确认您的配置按预期运行。
在此步骤中,您安装了 MongoDB 导出器,并将其配置为 Prometheus 目标来收集指标。
步骤 3 — 在Grafana中构建一个MongoDB仪表板
在此步骤中,您将构建一个仪表板,以便在Grafana中可视化您的MongoDB数据。要做到这一点,您将在Grafana中添加Prometheus作为数据源,并从Percona(https://docs.percona.com/percona-monitoring-and-management/index.html)导入MongoDB仪表板。Percona为MongoDB提供多个仪表板,您可以在Percona产品文件(https://docs.percona.com/percona-monitoring-and-management/details/dashboards/dashboard-mongodb-experimental_collection_overview.html)中找到。对于本教程,您将导入MongoDB概览仪表板(https://www.percona.com/doc/percona-monitoring-and-management/1.x/dashboard.mongodb-overview.html#mongodb-overview)到您的Grafana实例。
作为前提条件的一部分,您 安装并保护 Grafana。 导航到您的 Grafana 实例在 your_domain:3000,并使用您在前提条件期间创建的凭证登录。
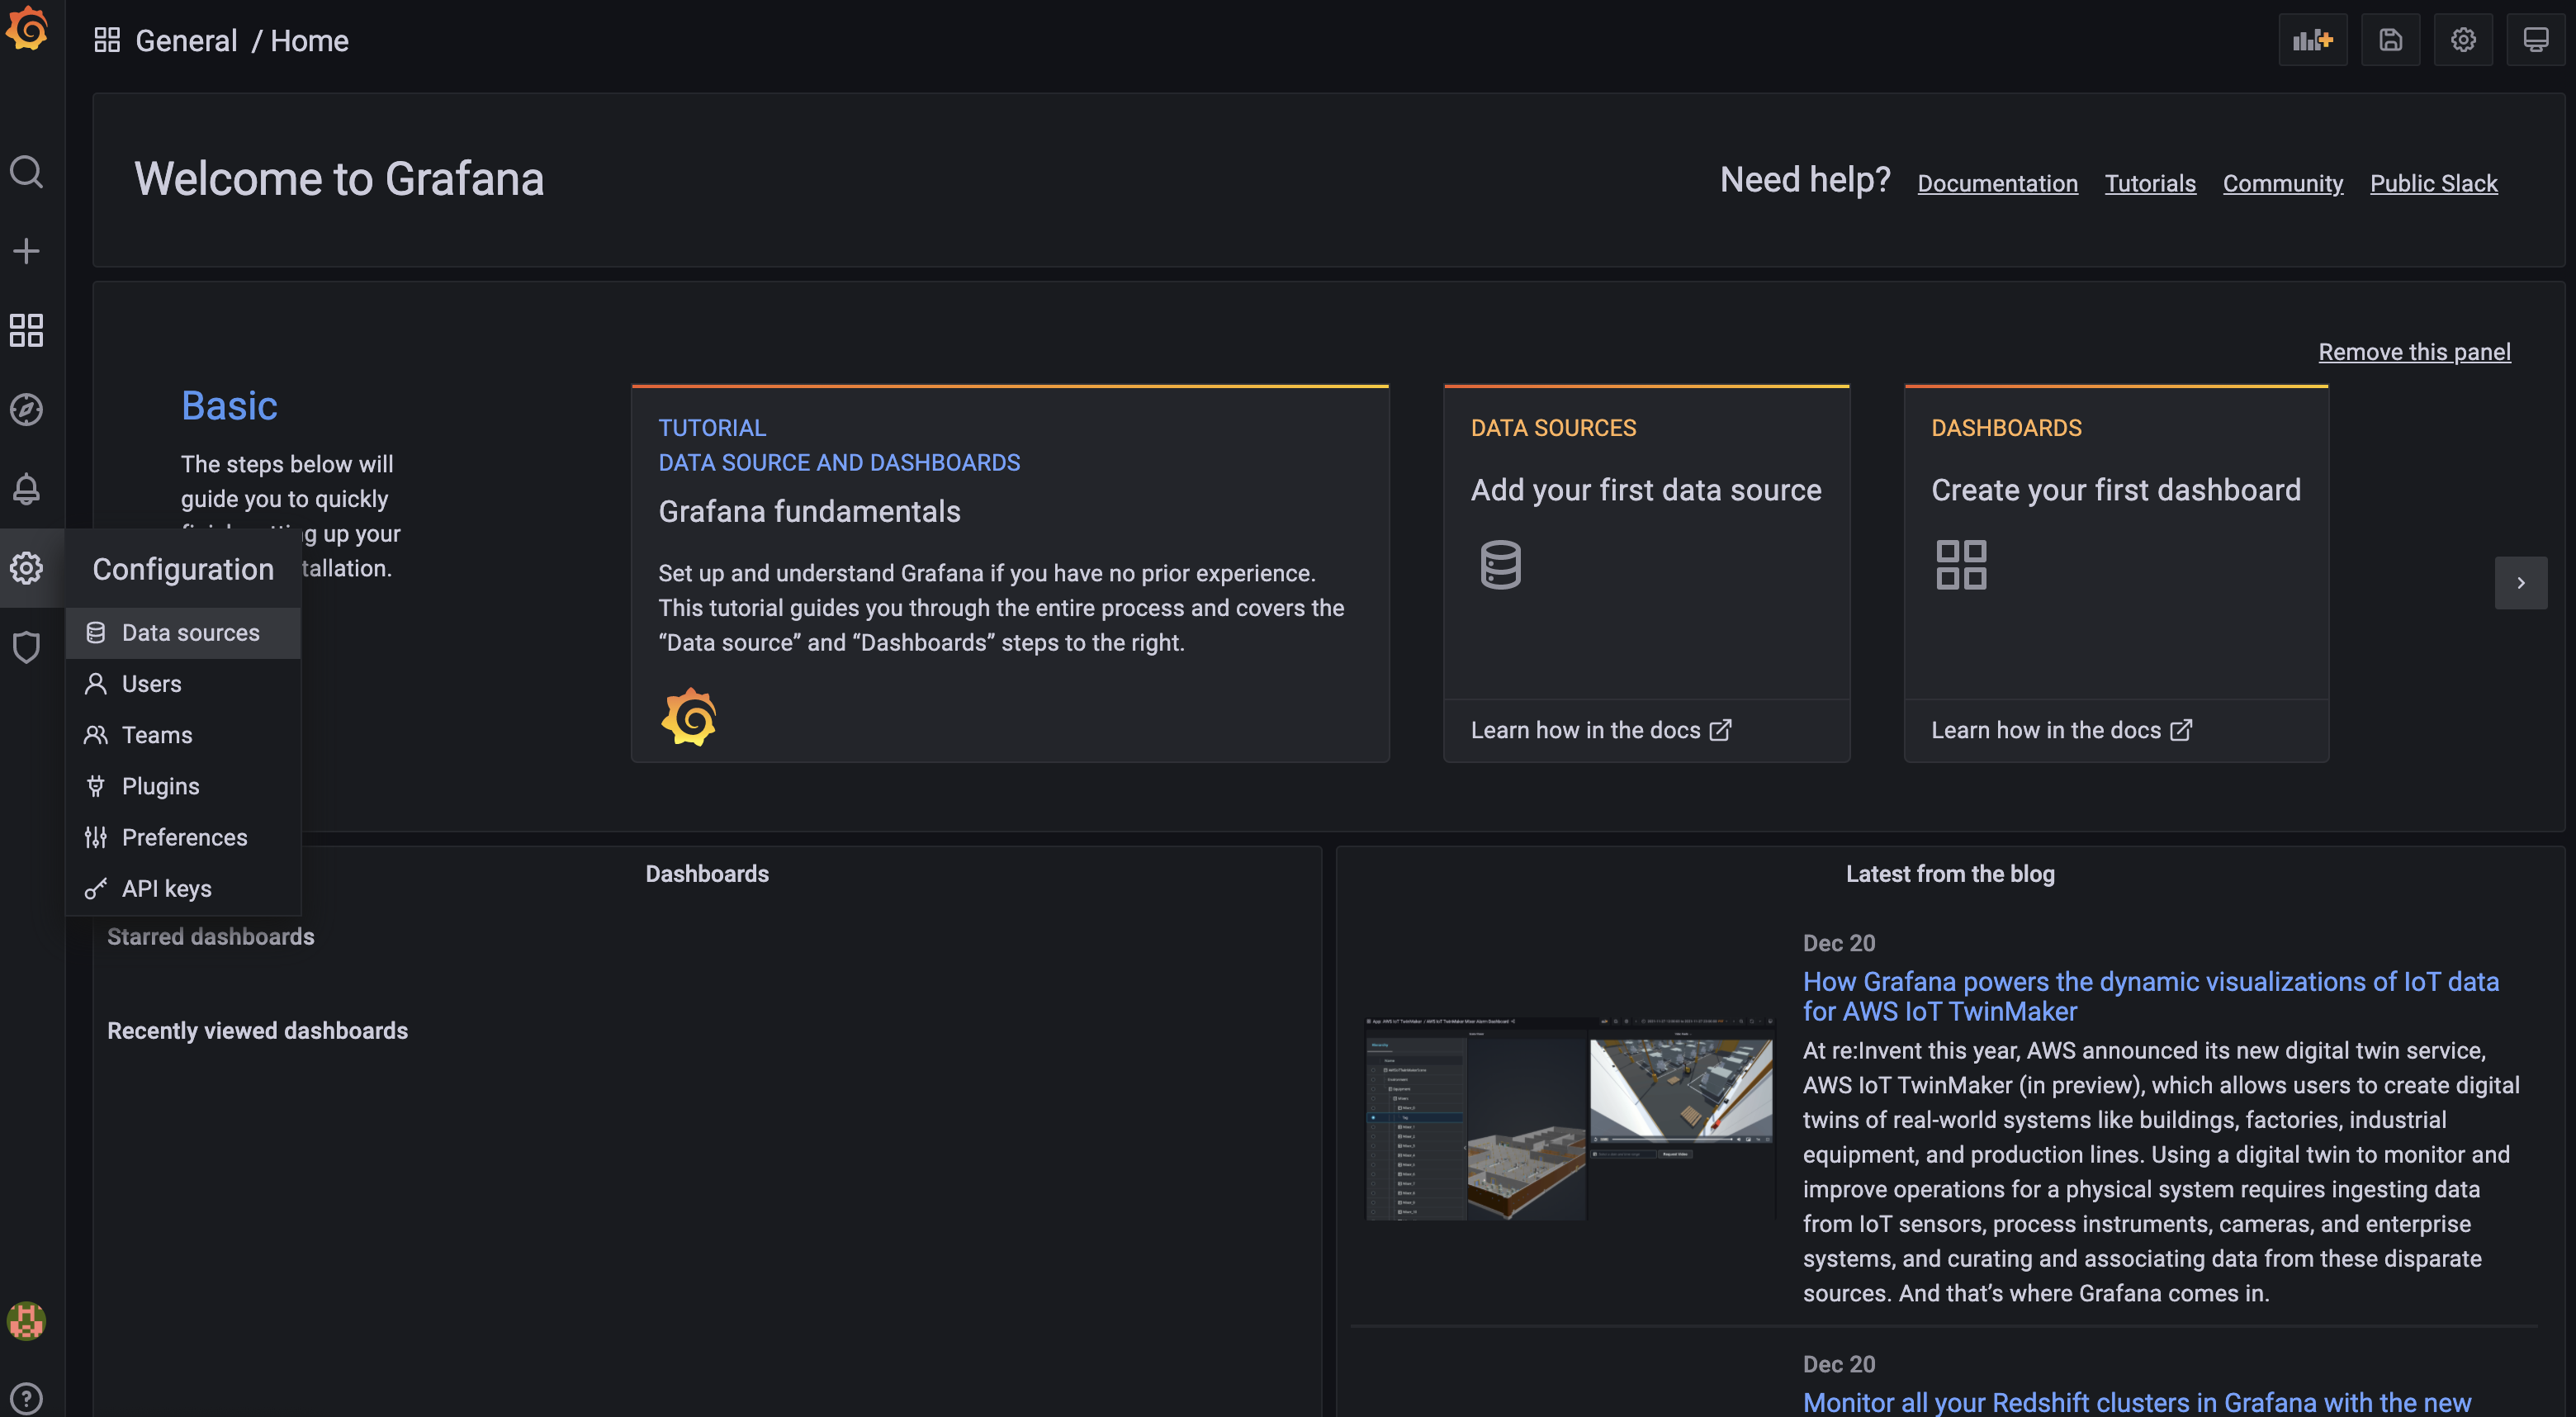
在左侧面板中,单击配置的齿轮图标,然后选择数据源:
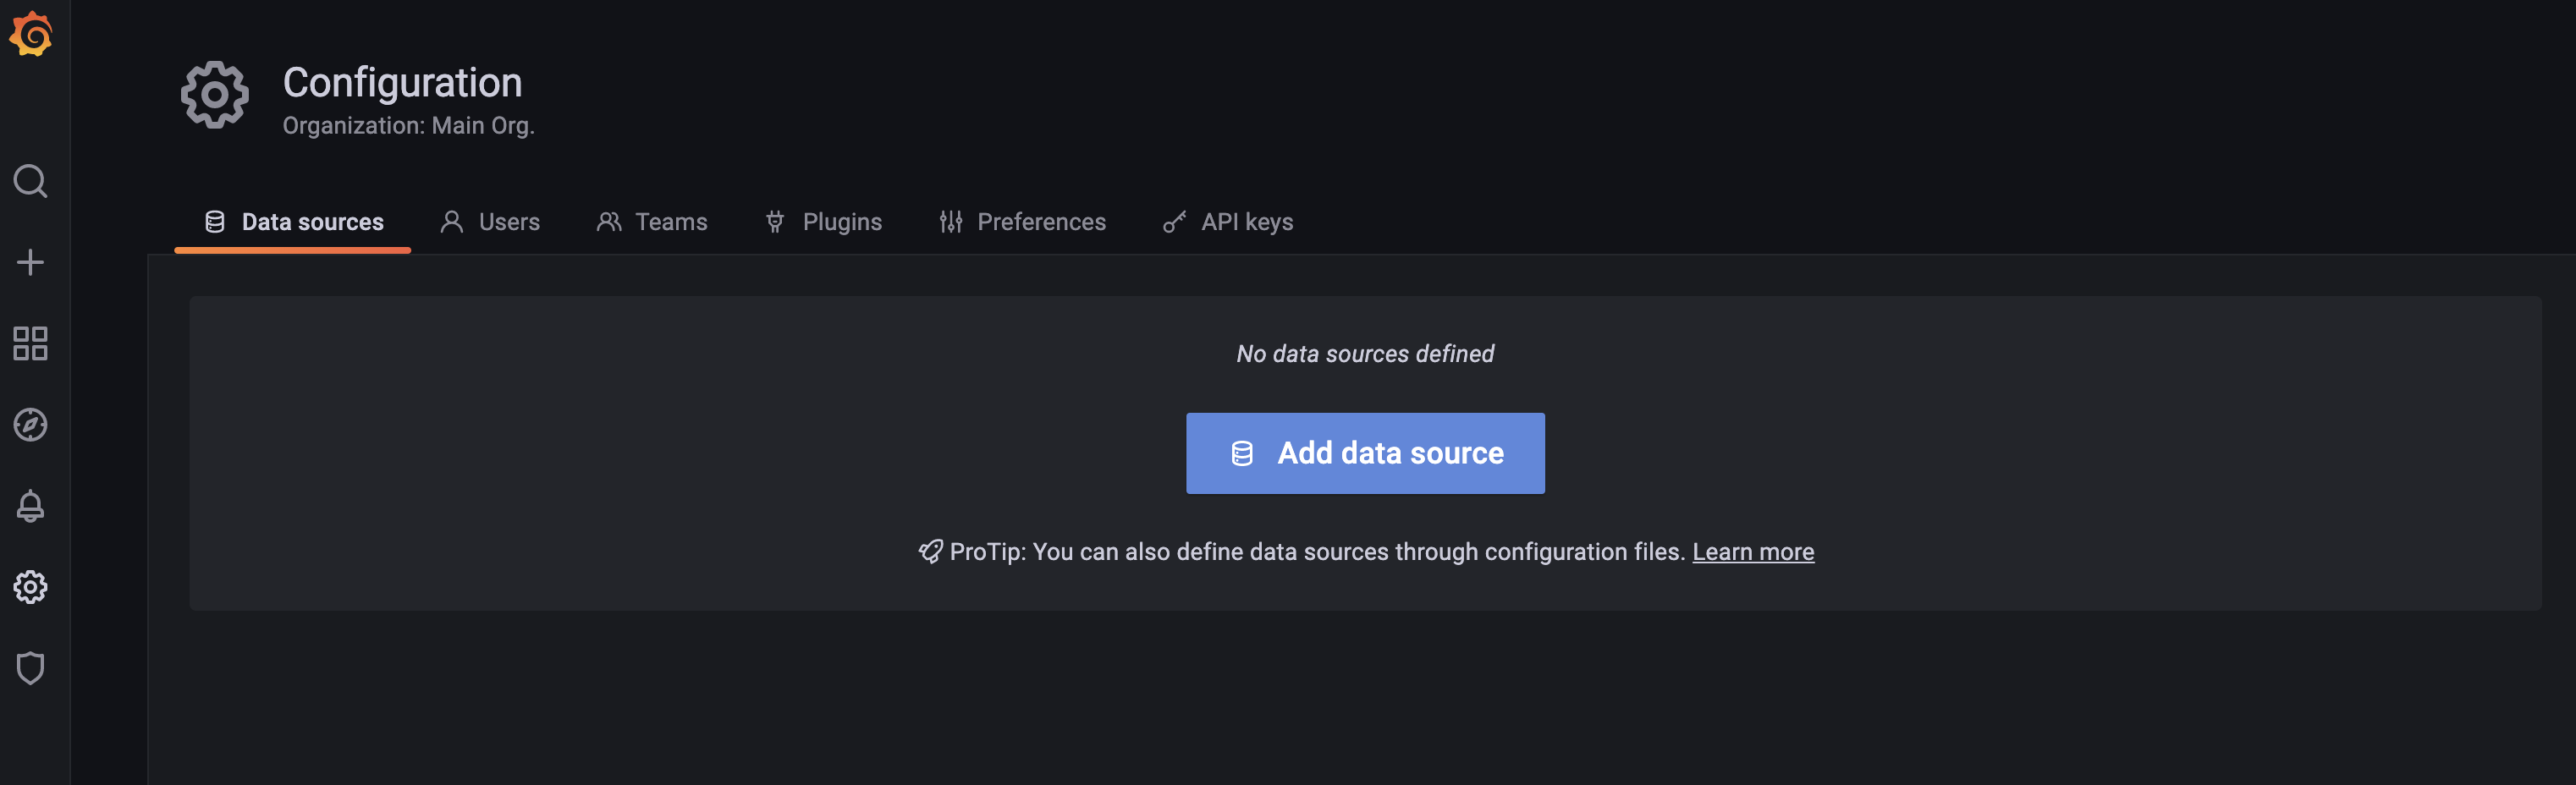
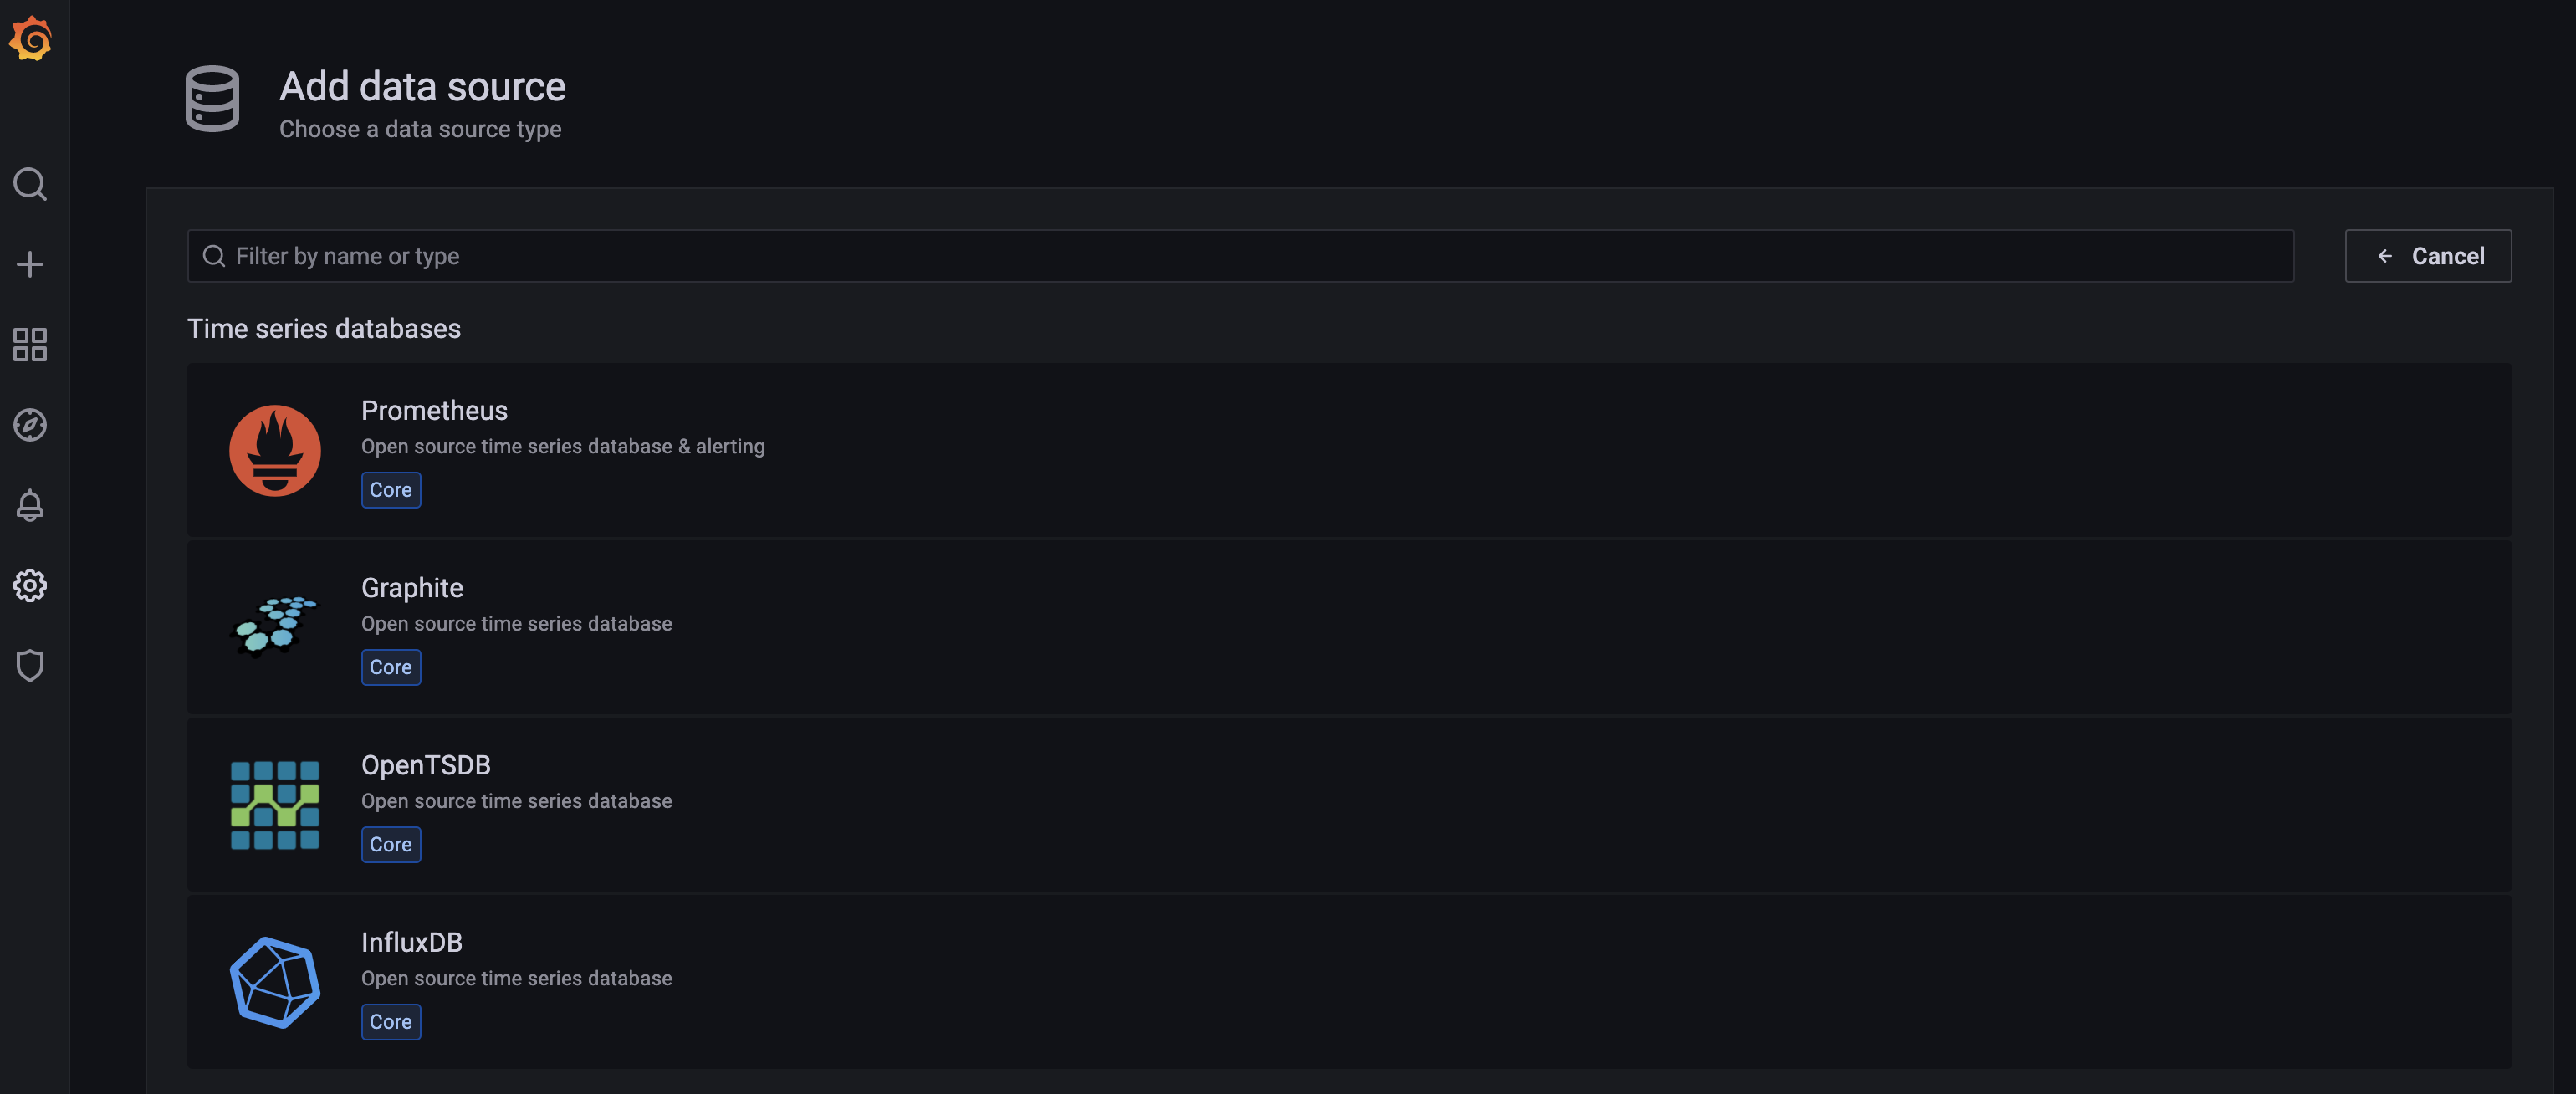
点击 ** 添加数据源**:
然后选择 Prometheus:
在下一个屏幕上,您将为您的 Prometheus 数据源配置 设置:
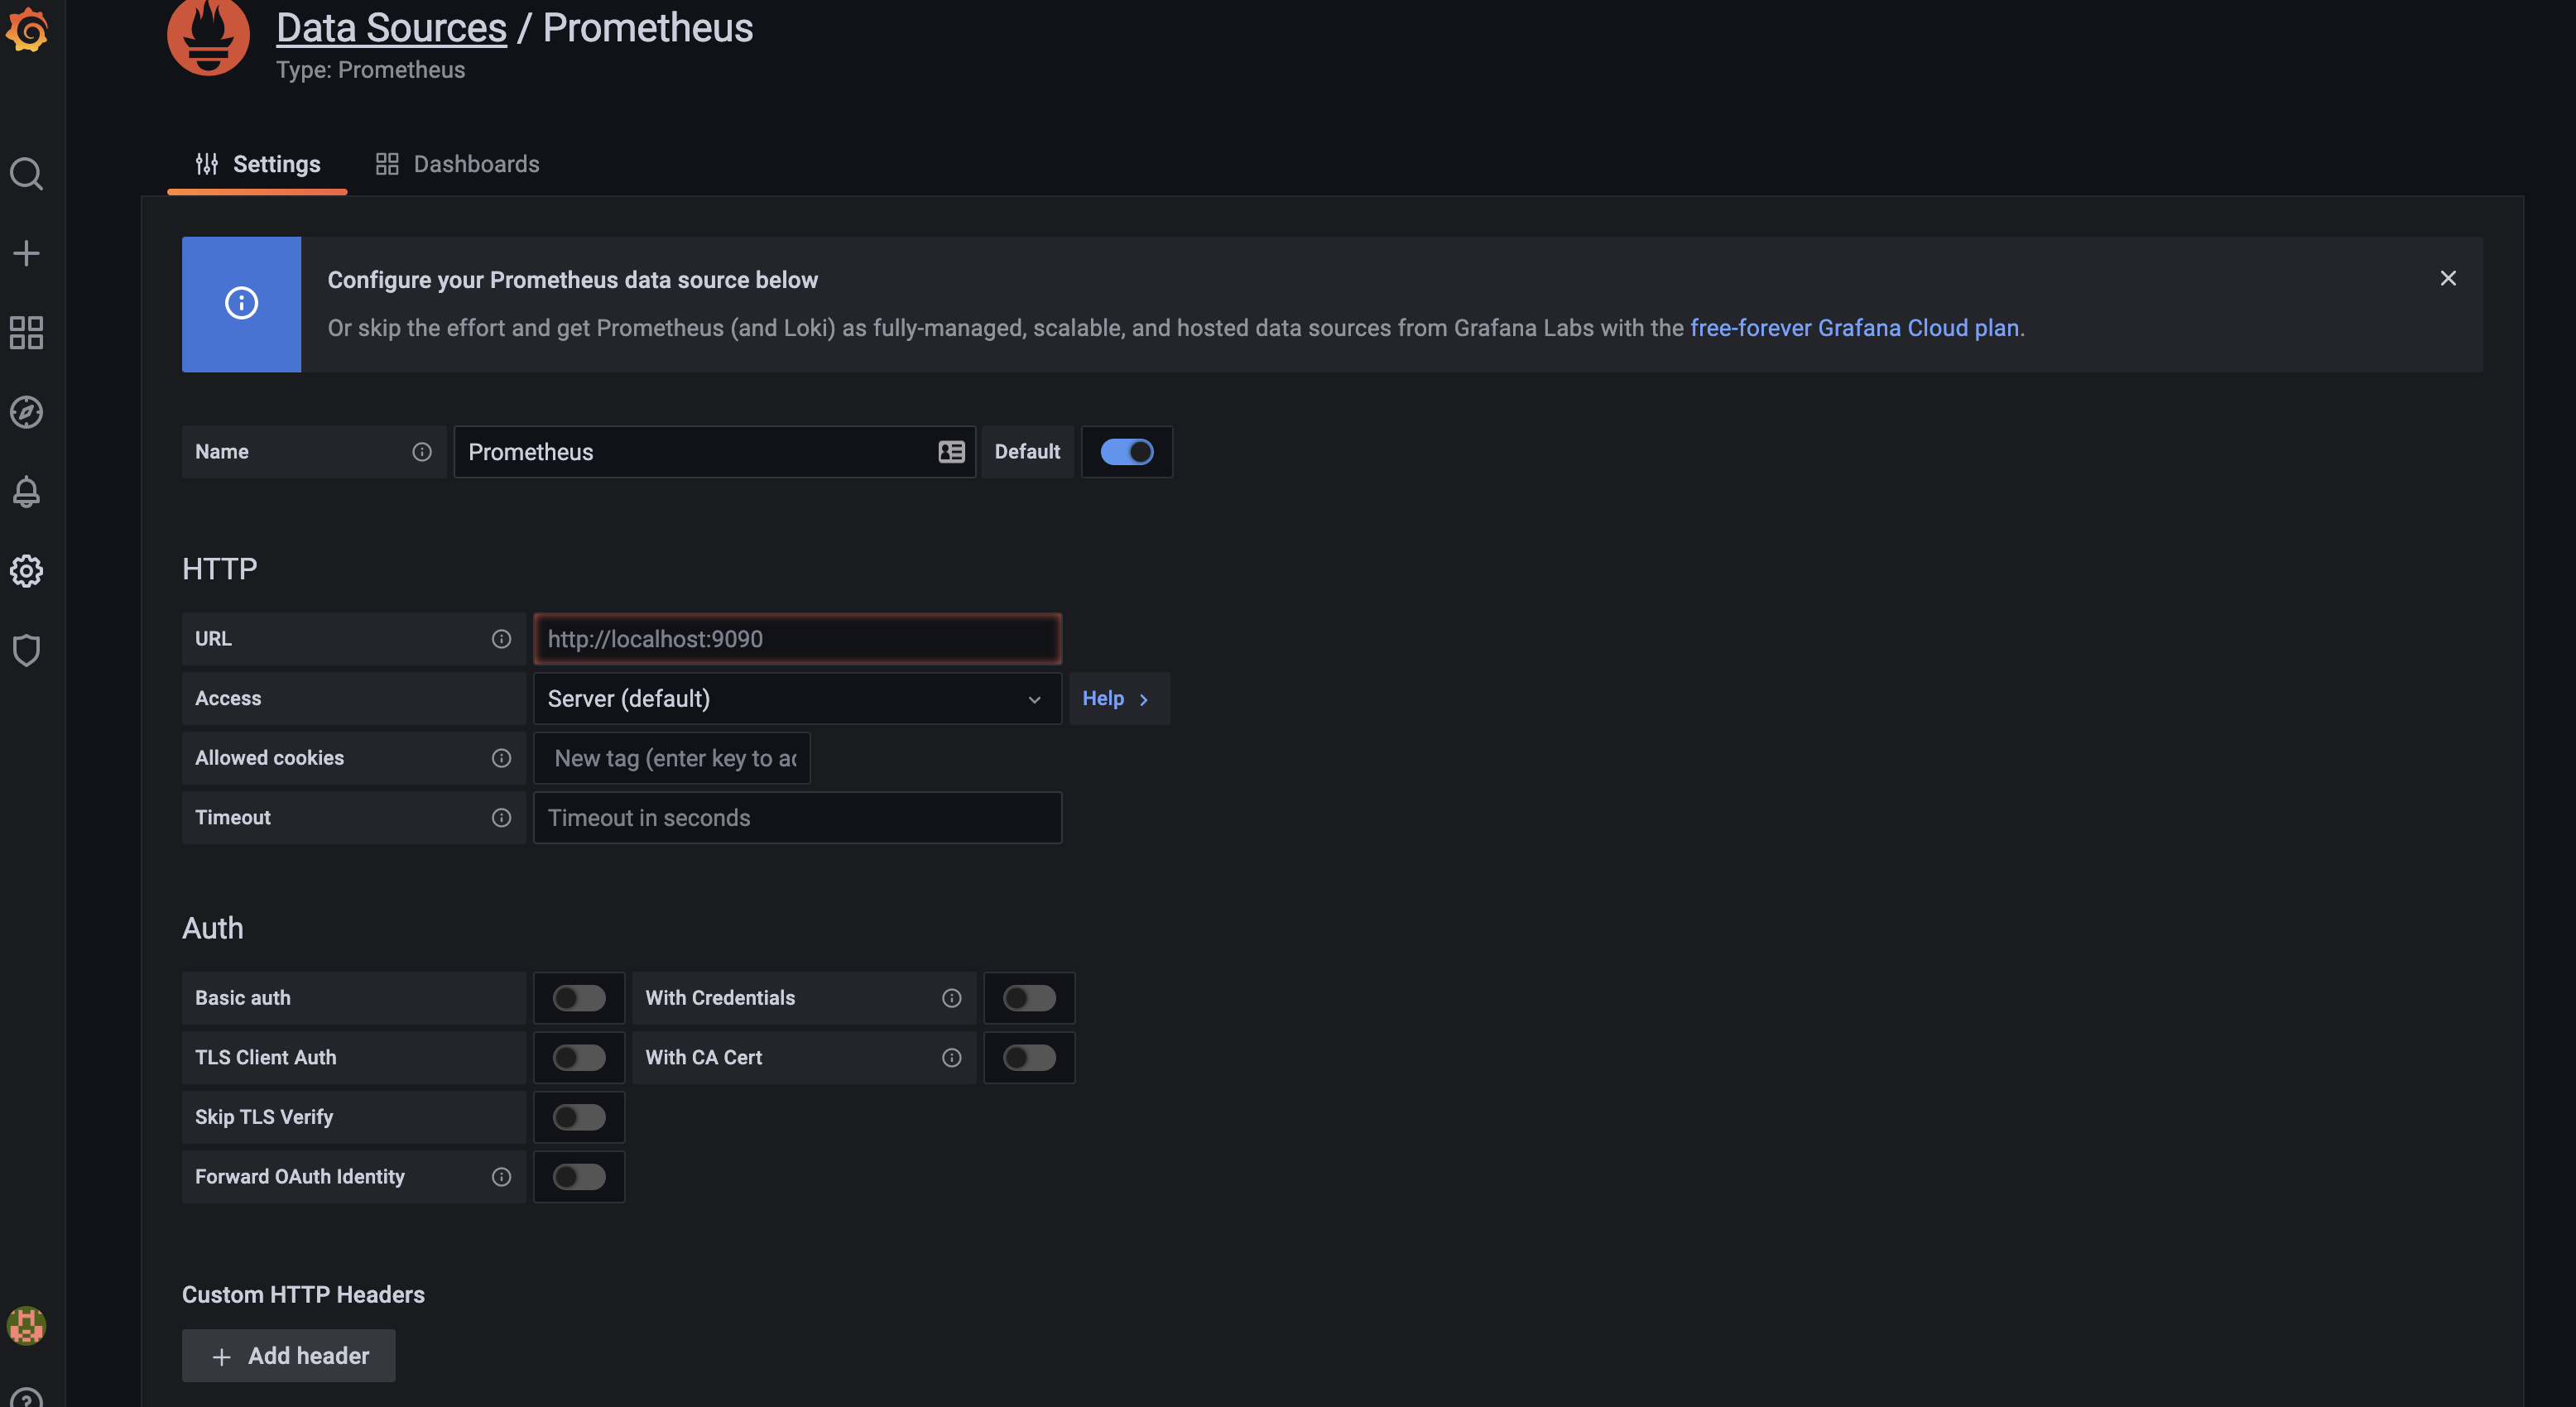
在 URL字段中,输入您的 Prometheus 实例的 URL:
1http://your_server_ip:9090/
点击屏幕底部的 ** 保存 & 测试 ** 现在 Prometheus 已被添加为 Grafana 的数据源。
接下来,您将导入对 Grafana 的 **MongoDB 概览 ** 仪表板. 您可以通过上传 JSON 文件或导入仪表板 ID 来导入仪表板,您可以在 Grafana 产品文件对仪表板中找到。
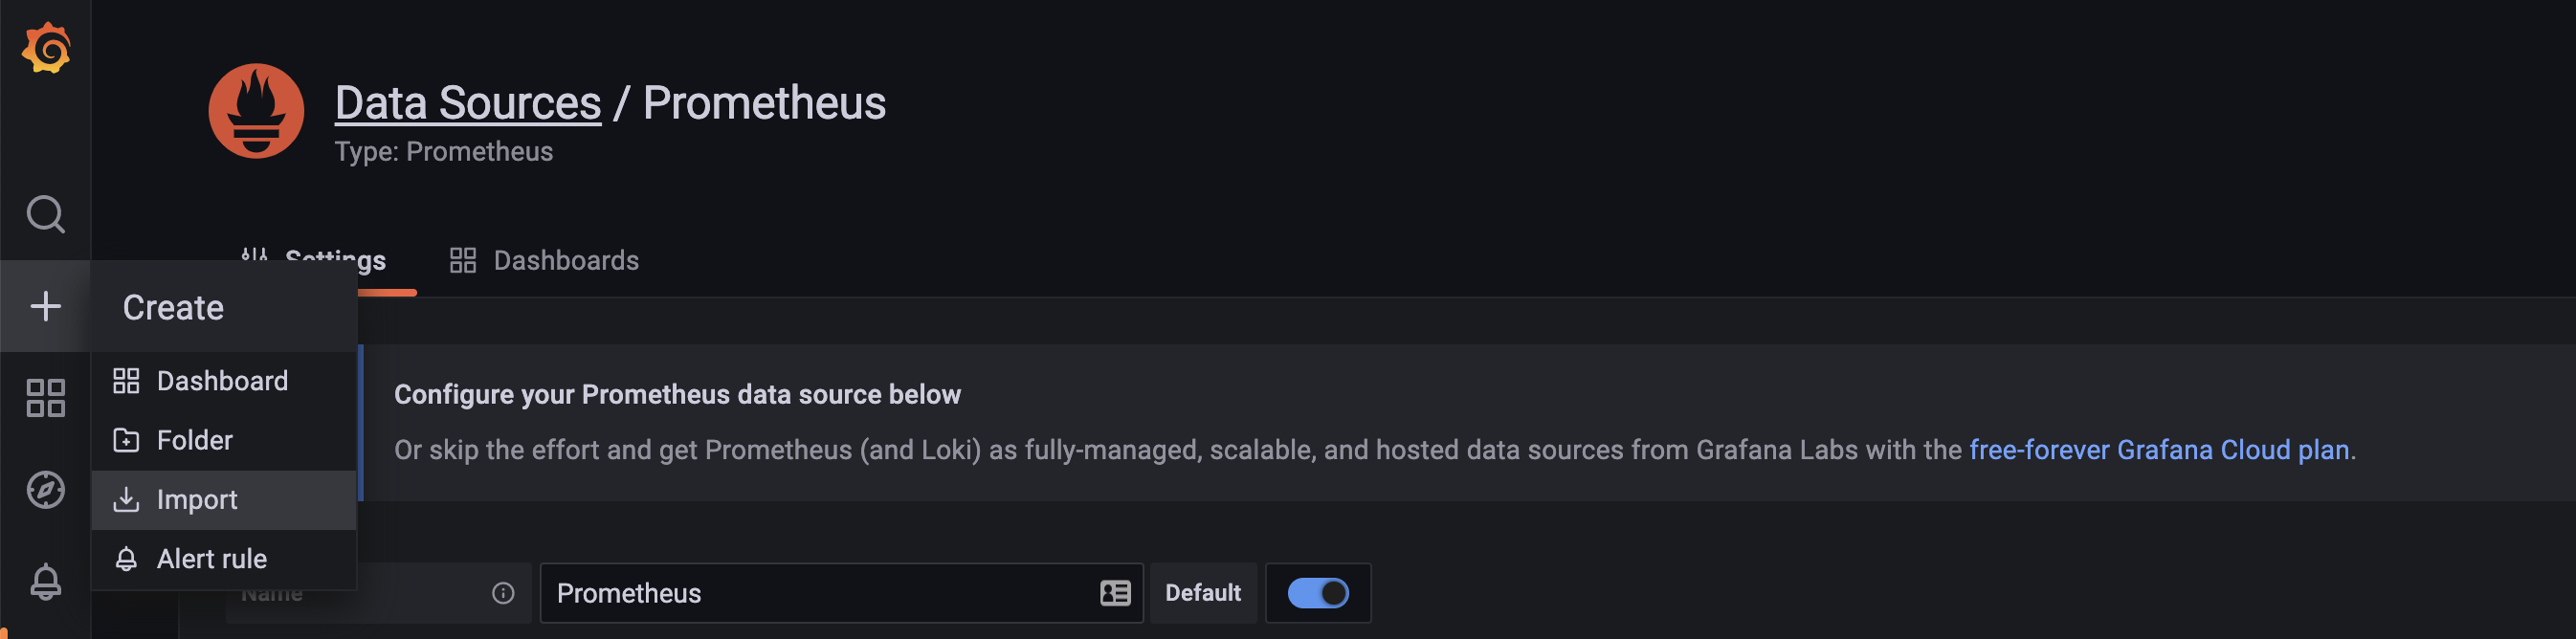
在左侧菜单中,点击 Create的加图标,然后选择 Import. 从那里,您将被带到 Import页面:
在这里,您可以上传仪表板的 JSON 文件或粘贴 Grafana 仪表板 ID:
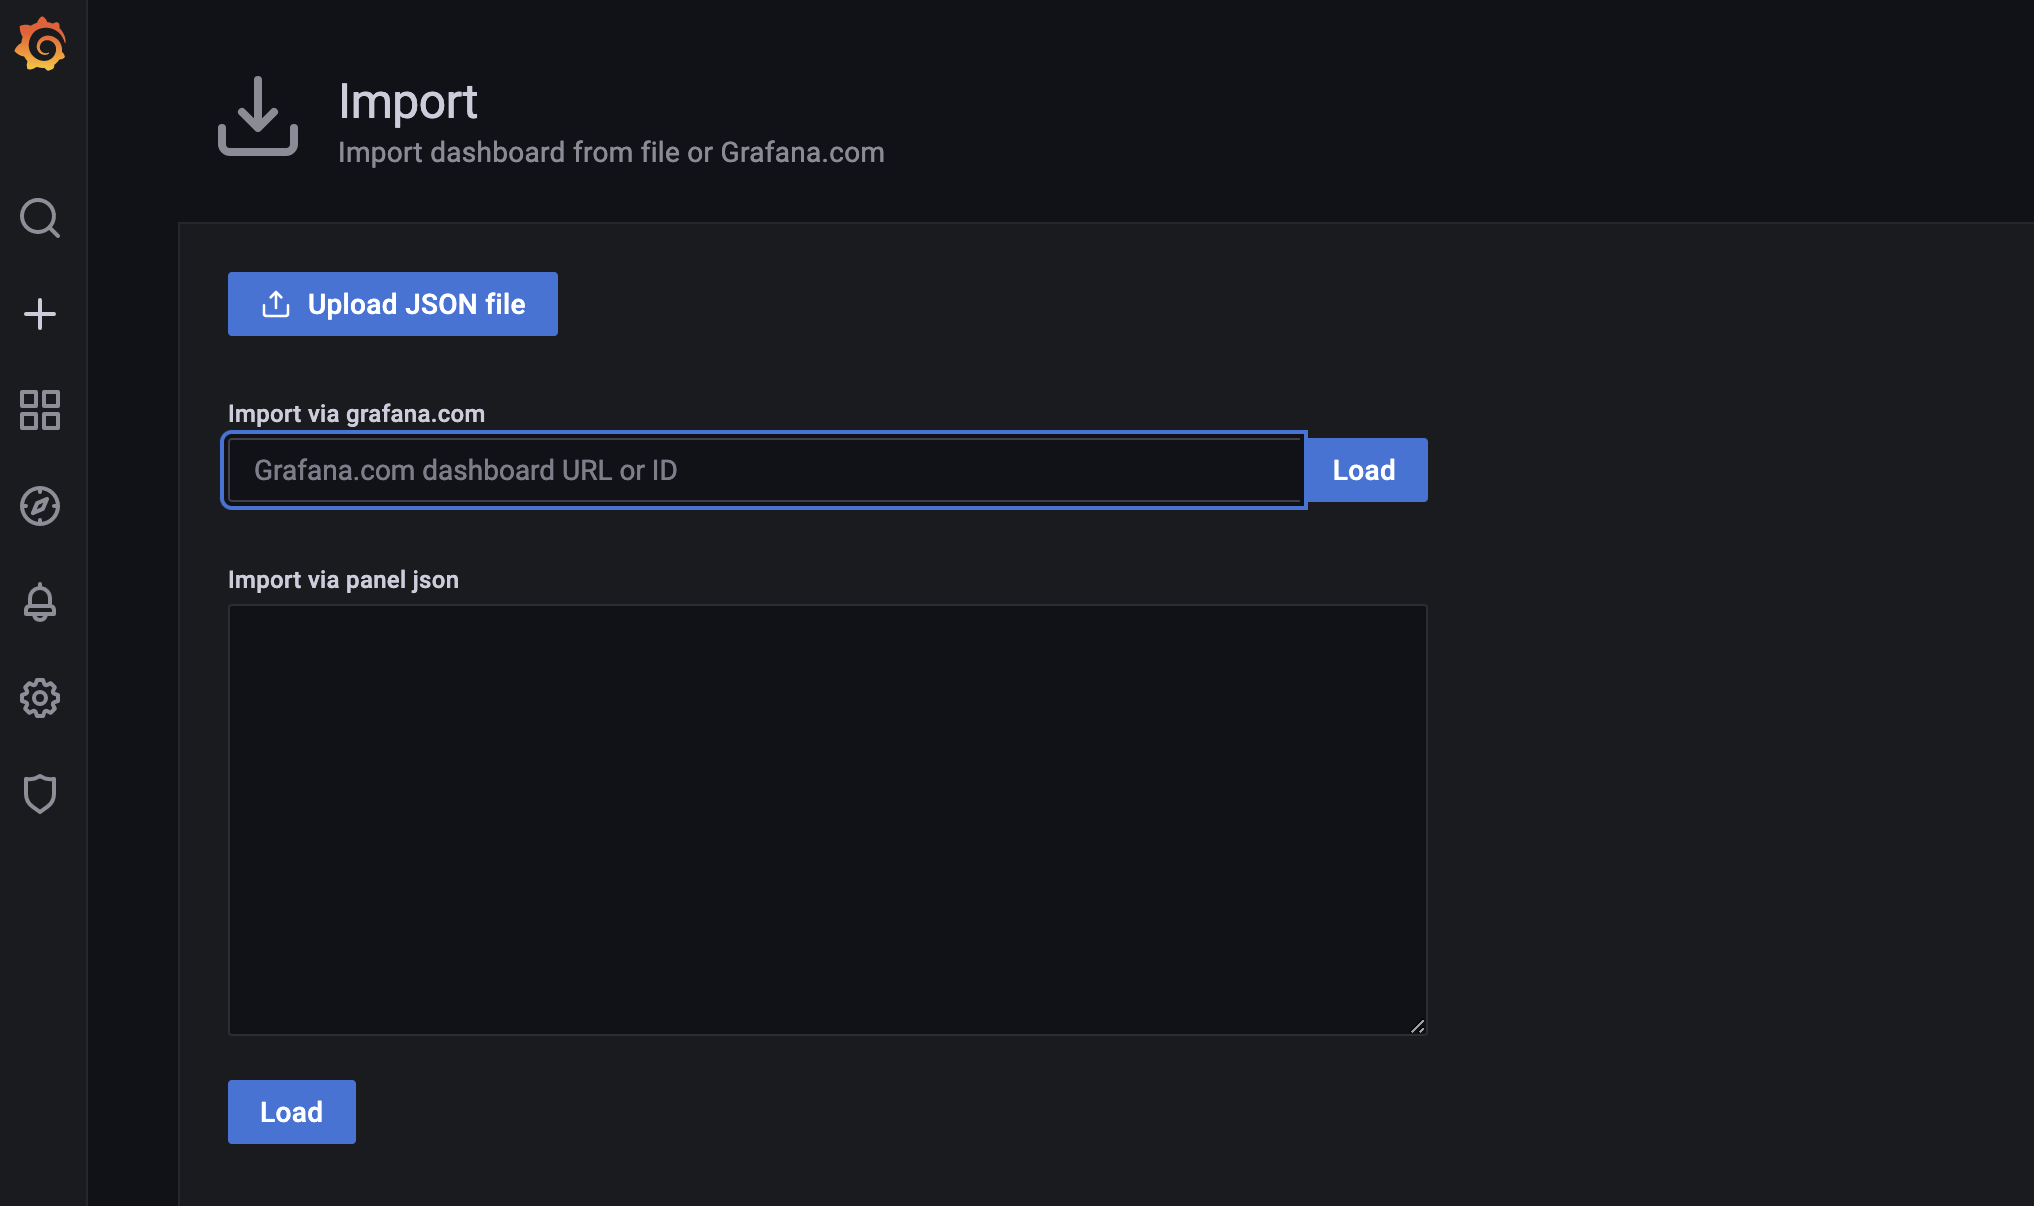
添加 Grafana 仪表板 ID,您可以在 Grafana 页面为 MongoDB 概览仪表板中找到:
1https://grafana.com/grafana/dashboards/7353
您可以通过访问 Grafana 在仪表板上的页面找到更多信息。
添加仪表板 ID 后,单击 Load。
现在将打开一个 ** 选项** 页面,您可以为仪表板提供一个名称,选择仪表板的文件夹,然后选择数据源. 您可以将仪表板和文件夹名称留为默认。
将创建一个Dashboard:
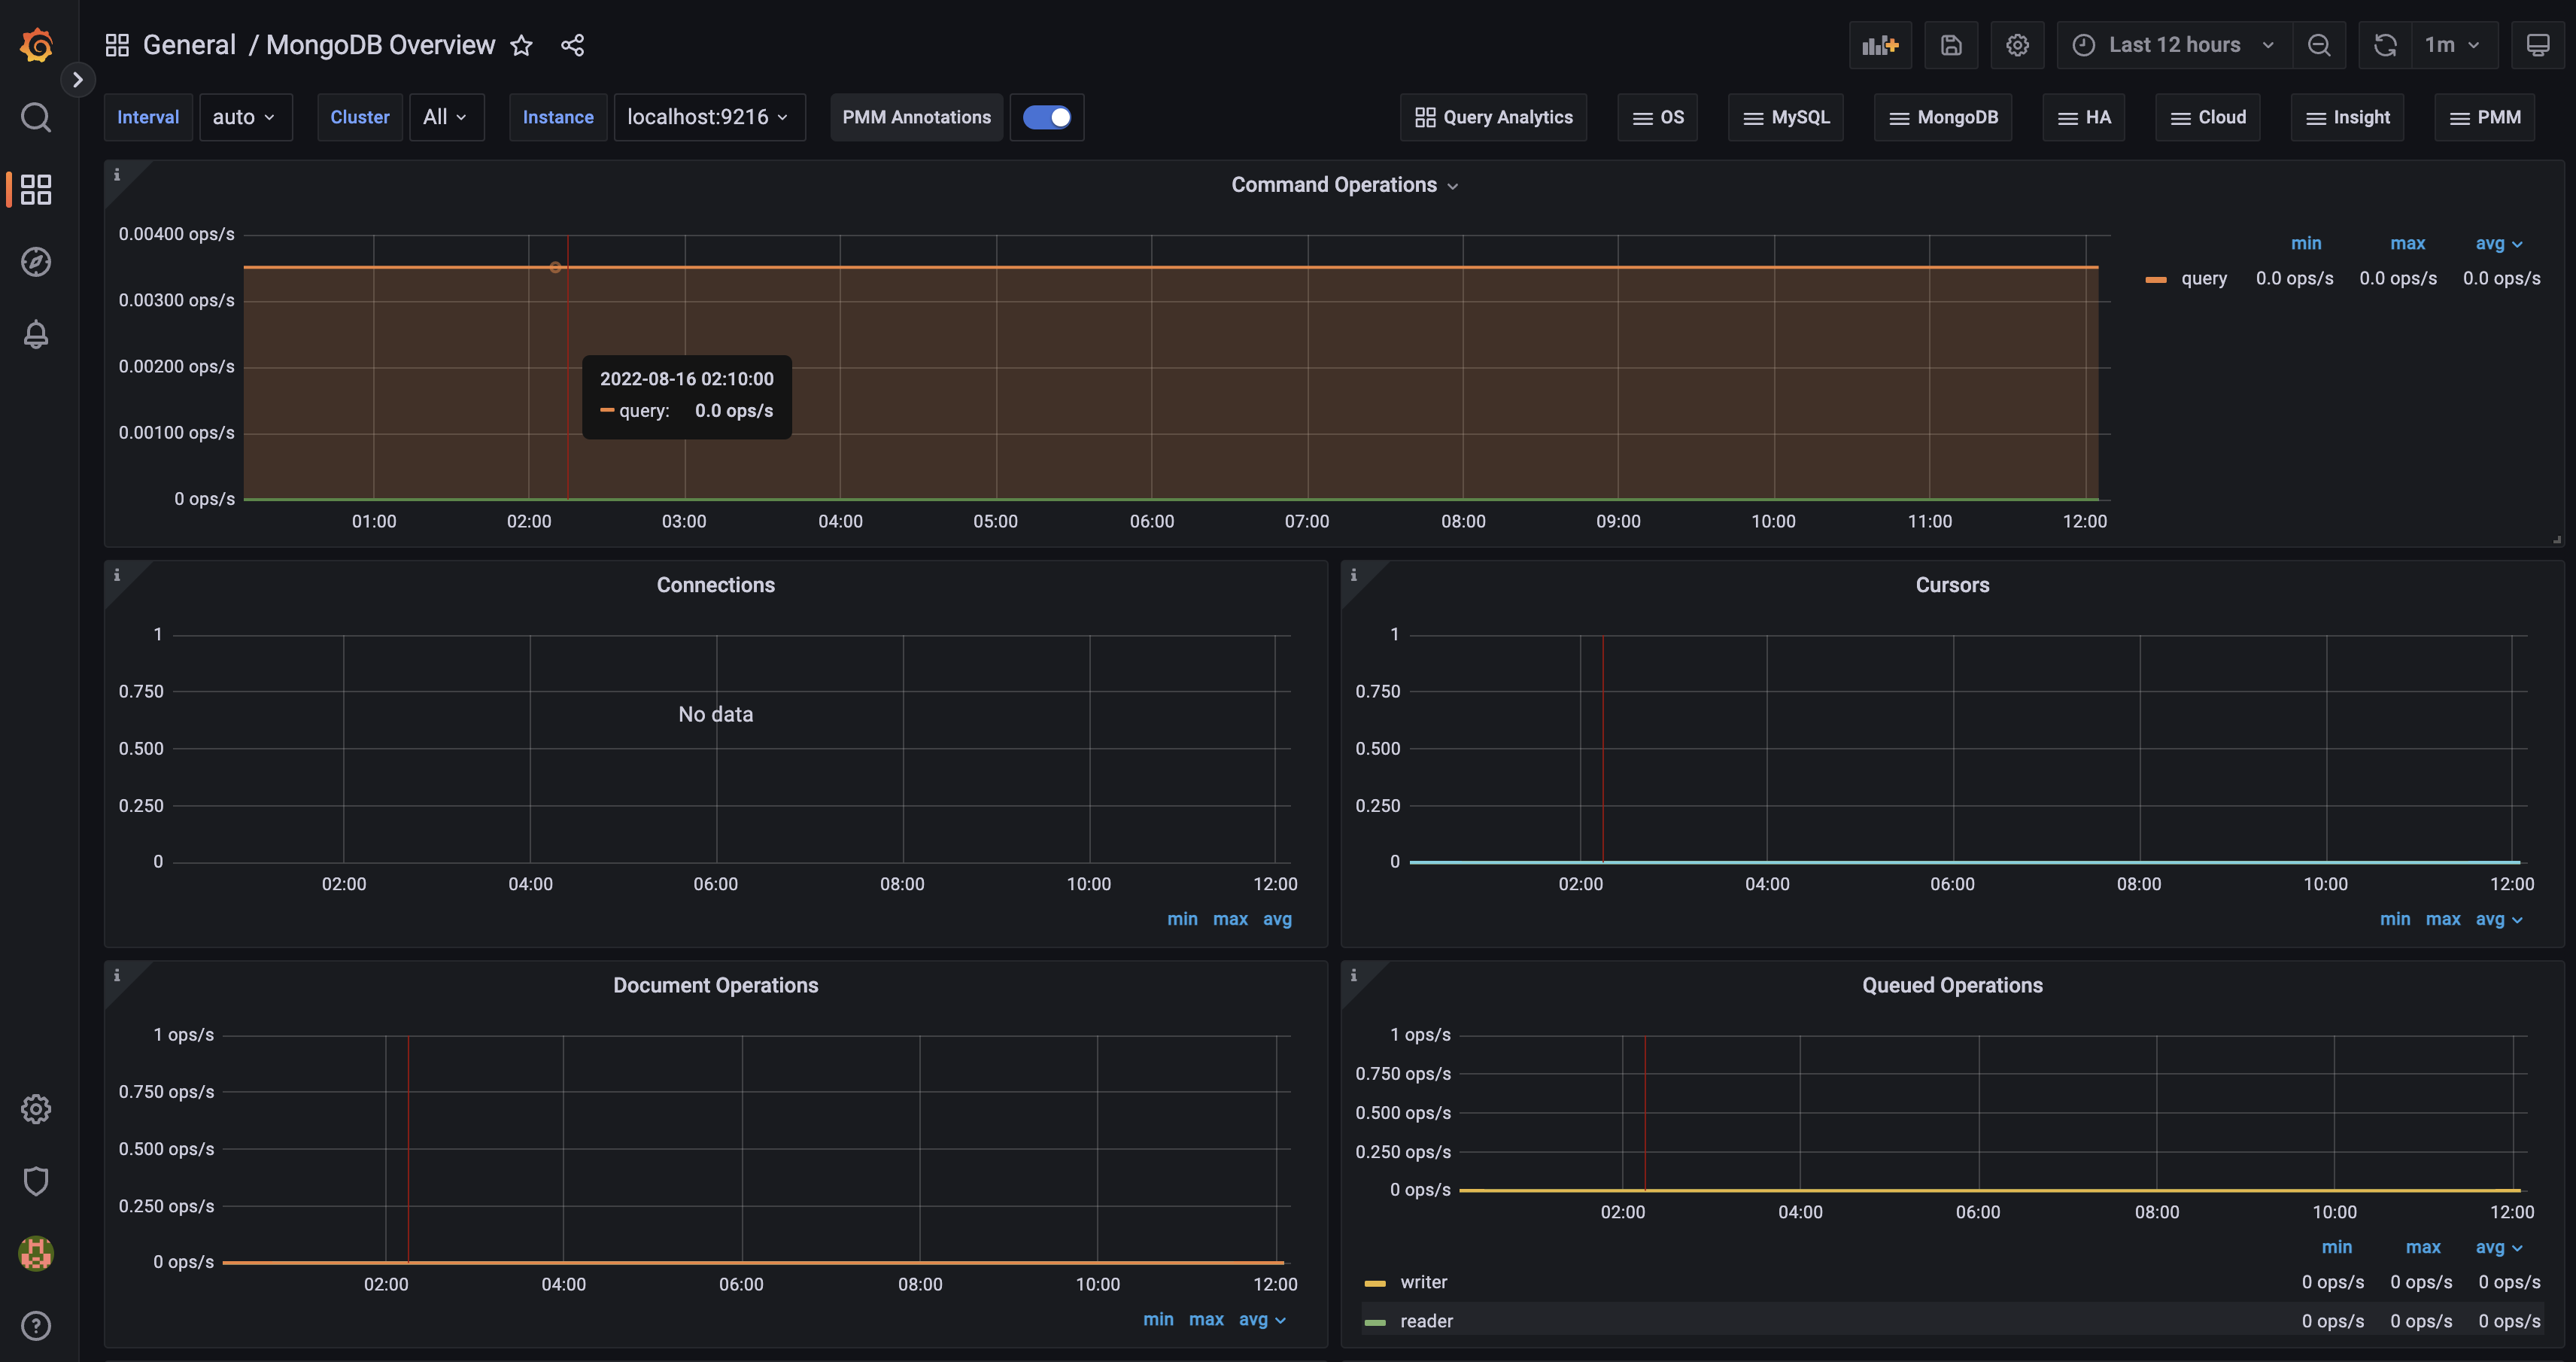
您的仪表板将显示您的 MongoDB 数据库的实时更新,包括命令操作、连接、路由器、文档操作和排列操作。
结论
在本文中,您设置了一个 Grafana 仪表板来监控您的 MongoDB 数据库的 Prometheus 指标,这使您可以通过 GUI 仪表板监控您的数据库。 首先,您安装了 Prometheus 并配置了 MongoDB 导出器。
现在,您已经为 MongoDB 建立了一个完全可行的监控管道,您可以更深入地挖掘它,然后尝试探索 Grafana 中的额外仪表板。
要了解更多关于 MongoDB 的信息,请参阅我们的 如何使用 MongoDB 管理数据 教程系列。
若要找到通往完全工作数据库环境的快速路径,请参阅 DigitalOcean 的 MongoDB 管理数据库。