介绍
监控系统在运行时接收和积累大量数据,监控系统运行的时间越长,它收集的数据就越多。
大多数监控系统都没有长期数据分析和存储的工具,它们要么会保持每个读取,导致存储问题,要么在达到一定的门槛时删除旧数据,这使我们无法在很长一段时间内分析我们的系统性能。
一些监控系统,如Zabbix,能够存储准确和平均数据值,但其定制能力非常有限。
时间序列数据库帮助我们解决存储大量历史数据的问题。
在本教程中,我们将向您展示如何安装和配置 Graphite - 一个用于存储数字时间序列数据和渲染这些数据的图表的工具。
- Carbon - 一个听取时间序列数据并使用存储后端写入磁盘的戴蒙
- Whisper - 一个类似于RRDTool的简单数据库来存储时间序列数据
- Graphite-Web - 一个Django的Web应用程序,可渲染图形并提供丰富的功能可视化和分析所获得的数据
在我们的最终配置中,我们的监控代理将数据点发送到Carbon,其中有碳传输器、碳聚合器和碳缓存组件。Carbon将数据写入Whisper数据库。
前提条件
在您开始之前,请确保您完成了以下步骤:
- 部署 CentOS 7 Droplet
- 通过遵循 初始服务器设置
- 添加交换空间向您的服务器添加一个 sudo 用户;例如 4 GB 的量很好
- 启用 EPEL (Extra Packages for Enterprise Linux) 存储库:
1sudo yum -y install epel-release
更新您的系统:
1sudo yum -y update
有关 EPEL 存储库的更多信息可在 fedoraproject.org上找到。
步骤 1 – 安装石墨和碳
安装所需的应用程序,包括Python相关的工具和Apache Web 服务器:
1sudo yum install httpd mod_wsgi python-pip python-devel git pycairo libffi-devel
从 GitHub 获取最新的 Graphite 和 Carbon 源文件:
1cd /usr/local/src
2sudo git clone https://github.com/graphite-project/graphite-web.git
3sudo git clone https://github.com/graphite-project/carbon.git
查看要求:
1python /usr/local/src/graphite-web/check-dependencies.py
您将看到以下消息:
1[REQUIRED] Unable to import the 'whisper' or 'ceres' modules, please download this package from the Graphite project page and install it.
2
3    . . .
4
5    6 optional dependencies not met. Please consider the optional items before proceeding.
6    5 necessary dependencies not met. Graphite will not function until these dependencies are fulfilled.
所以你必须安装缺少的模块. 首先安装 gcc:
1sudo yum install gcc
然后安装模块:
1sudo pip install -r /usr/local/src/graphite-web/requirements.txt
然后检查django-tagging包的版本:
1pip show django-tagging
如果包的版本小于 0.3.4,那么您应该更新它:
1sudo pip install -U django-tagging
再次检查要求:
1python /usr/local/src/graphite-web/check-dependencies.py
现在你应该看到以下结果:
1[OPTIONAL] Unable to import the 'ldap' module, do you have python-ldap installed for python 2.7.5? Without python-ldap, you will not be able to use LDAP authentication in the graphite webapp.
2[OPTIONAL] Unable to import the 'python-rrdtool' module, this is required for reading RRD.
32 optional dependencies not met. Please consider the optional items before proceeding.
4All necessary dependencies are met.
我们在本教程中不需要LDAP身份验证或RRD数据库。
碳水化合物:
1cd /usr/local/src/carbon/
2sudo python setup.py install
安装 Web 应用程序:
1cd /usr/local/src/graphite-web/
2sudo python setup.py install
现在所有组件都已安装,您已经准备好配置 Graphite。
Graphite 包含多个样本配置文件,您只需复制和编辑它们,如下一步所示。
步骤 2 - 配置碳
碳包括几个服务:
carbon-cache- 接受指标并将其写入磁盘carbon-relay- 复制数据carbon-aggregator- 运行在前方的carbon-cache以缓冲指标的时间,然后将其传送到 Whisper
最后两种是可选的。
碳配置文件
主要配置文件是 carbon.conf. 它定义了每个碳大象的设置。
让我们做一个例子文件的副本:
1sudo cp /opt/graphite/conf/carbon.conf.example /opt/graphite/conf/carbon.conf
该文件中的每个设置都通过文件本身中的信息性评论进行记录,您可以查看它们,但对于我们的教程,默认设置是合适的。
存储计划
接下来,您需要编辑storage-schemas.conf文件,该文件描述了存储指标的保留率,它匹配了指标路径与模式,并告诉Whisper要存储数据点的频率和历史。
数据所占用的磁盘空间的大小取决于该文件中的设置。
首先,创建示例文件的副本:
1sudo cp /opt/graphite/conf/storage-schemas.conf.example /opt/graphite/conf/storage-schemas.conf
让我们打开文件来编辑:
1sudo vi /opt/graphite/conf/storage-schemas.conf
默认情况下,它包含两个部分:
1[carbon]
2pattern = ^carbon\.
3retentions = 60:90d
4
5[default_1min_for_1day]
6pattern = .*
7retentions = 60s:1d
每个部分有:
- 一个名称,指定在方块内
- 一个规则表达式,指定后
pattern= - 一个保留率线,指定后
retentions=
例如,让我们添加一个新的部分:
1[zabbix_server]
2pattern = ^Zabbix_server\.
3retentions = 30s:7d,5m:30d,10m:1y
正常表达式模式将匹配任何以 `Zabbix_server 开头的指标。
*每个数据点代表30秒,我们希望以这种频率保持最多7天的数据 *过去30天的所有历史数据都以5分钟的间隔存储 *过去一年所有的历史数据都以10分钟的间隔存储
Whisper会降低指标,因为保留的门槛被超越。
<$>[注] 注: 部分以从顶部到底部的顺序应用,并使用与计量名称匹配的第一个模式! <$>
存储集成(可选)
接下来,您可能需要存储-aggregation.conf 文件,该文件定义了如何将数据合并到更低精度的保留。
创建示例文件的副本:
1sudo cp /opt/graphite/conf/storage-aggregation.conf.example /opt/graphite/conf/storage-aggregation.conf
让我们来看看档案:
1sudo vi /opt/graphite/conf/storage-aggregation.conf
默认情况下,它包含4个部分:
 1[min]
 2pattern = \.min$
 3xFilesFactor = 0.1
 4aggregationMethod = min
 5
 6[max]
 7pattern = \.max$
 8xFilesFactor = 0.1
 9aggregationMethod = max
10
11[sum]
12pattern = \.count$
13xFilesFactor = 0
14aggregationMethod = sum
15
16[default_average]
17pattern = .*
18xFilesFactor = 0.5
19aggregationMethod = average
类似于storage-schemas.conf文件,每个部分都有一个名称在方块中,一个规则表达式在pattern=之后。
xFilesFactor指定了上一保留级别的分区必须具有非零值的部分,以便合并到非零值。 默认值为0.5aggregationMethod指定了用于合并下一保留级别的值的函数(平均,总,min,max,last)。
默认情况下,当数据达到下一个保留间隔时,Graphite 会将所有以 .count 结尾的指标合计,获得以 .min/.max 结尾的所有指标的最小/最大值,以及其他所有指标的平均值。
传感器(可选)
碳连接可以与(或代替)碳缓存一起运行,并将输入的指标转移到运行在不同端口或主机上的多个后端的碳缓存。
要配置数据传输到其他主机,您必须编辑相应的配置文件。
1sudo cp /opt/graphite/conf/relay-rules.conf.example /opt/graphite/conf/relay-rules.conf
打开文件以编辑:
1sudo vi /opt/graphite/conf/relay-rules.conf
默认情况下,它包含一个单个部分,该部分将数据发送到 localhost:
1[default]
2default = true
3destinations = 127.0.0.1:2004:a, 127.0.0.1:2104:b
(:a 和 :b 意味着在同一个主机上可以运行多个碳缓存实例)
下面的示例显示了将数据从Zabbix_server发送到一个主机的carbon-relay设置,并将所有其他数据发送到其他三个主机:
1[zabbix]
2pattern = ^Zabbix_server\.
3destinations = 10.0.0.4:2004
4
5[default]
6default = true
7destinations = 127.0.0.1:2004, 10.0.0.2:2024, 10.0.0.3:2004
第一节中的常规表达式模式将匹配任何以Zabbix_server开头的指标,所有数据将以10.0.0.4 IP 地址传输给主机。所有其他数据将传输给 localhost 和其他两个主机。
在relay-rules.conf中列出的所有目的地也必须列入/opt/graphite/conf/carbon.conf文件中,在[relay]部分的DESTINATIONS设置中:
1sudo vi /opt/graphite/conf/carbon.conf
我们添加了三个新的IP:
1[relay]
2...
3DESTINATIONS = 127.0.0.1:2004, 10.0.0.2:2024, 10.0.0.3:2004, 10.0.0.4:2004
4...
合并(可选)
碳聚合器用于缓冲指数,然后将其报告到Whisper数据库. 它可以在碳缓存前运行。 聚合规则允许您将多个指数添加在一起,从而减少了每个URL中的许多指数的总和。
要配置数据聚合,首先复制示例文件:
1sudo cp /opt/graphite/conf/aggregation-rules.conf.example /opt/graphite/conf/aggregation-rules.conf
该文件中的每个行的格式应如下:
1output_template (frequency) = method input_pattern
这将捕获任何与input_pattern匹配的收到的指标,用于计算集合指标。计算将发生每频率秒。可用的集合方法是:总和或avg。集合指标的名称将来自output_template填写任何从input_pattern捕获的字段。
例如,假设您的组织有 25 个分支机构,并且您想要构建其总互联网流量的图表。
- collectd.monitoring-host.branch-01.if_octets.rx
- collectd.monitoring-host.branch-02.if_octets.rx
- collectd.monitoring-host.branch-03.if_octets.rx
- ...
- collectd.monitoring-host.branch-25.if_octets.rx
您可以存储每个分支机构的数据,构建每个分支机构的图表,然后总结它们。
然而,这种类型的操作很昂贵:要返回汇总图,你首先需要读取25个不同的指标,然后你需要通过应用汇总函数来组合结果,最后构建图。
如果您只对总流量感兴趣,您可以预先计算值。 要做到这一点,您可以定义一个规则,该规则匹配正常表达式上的指标,缓冲它们在指定时间内,应用缓冲数据的函数,并将结果存储在单独的指标中。
1collectd.monitoring-host.branches.if_octets.rx (60) = sum collectd.monitoring-host.*.if_octets.rx
鉴于此配置,指数将缓冲60秒,结合使用总和函数,并存储到新的指数文件。
步骤3 – 开始作为服务的碳
配置 Carbon 的 init 脚本。
首先,将它们复制到 /etc/init.d/ 并使它们可执行:
1sudo cp /usr/local/src/carbon/distro/redhat/init.d/carbon-* /etc/init.d/
2sudo chmod +x /etc/init.d/carbon-*
开启碳缓存:
1sudo systemctl start carbon-cache
如果您选择使用它们,请启动碳连接器和碳聚合器:
1sudo systemctl start carbon-relay
2sudo systemctl start carbon-aggregator
Carbon 的配置完成了: Carbon 正在运行并准备接收数据,您现在可以配置 Web 界面。
步骤 4 – 配置 Graphite-Web 应用程序
Graphite-Web 是 Django 的 Web 应用程序,运行在 Apache/mod_wsgi 中。
复制示例设置文件:
1sudo cp /opt/graphite/webapp/graphite/local_settings.py.example /opt/graphite/webapp/graphite/local_settings.py
打开文件以编辑:
1sudo vi /opt/graphite/webapp/graphite/local_settings.py
查找SECRET_KEY并输入一个独特的值,用于提供加密签名;只要它是独一无二的,你可以把任何东西放在这里。查找TIME_ZONE更新到安装的时区。
1. . .
2
3SECRET_KEY = 'enter_your_unique_secret_key_here'
4
5. . .
6
7TIME_ZONE = 'America/Chicago'
8
9. . .
创建一个新的数据库:
1cd /opt/graphite
2sudo PYTHONPATH=/opt/graphite/webapp/ django-admin.py syncdb --settings=graphite.settings
提示将向您提出一些问题,以创建数据库的超级用户帐户:
 1Operations to perform:
 2      Synchronize unmigrated apps: url_shortener, account, dashboard, tagging, events
 3      Apply all migrations: admin, contenttypes, auth, sessions
 4    Synchronizing apps without migrations:
 5      Creating tables...
 6        Creating table account_profile
 7
 8      . . .
 9
10      Applying sessions.0001_initial... OK
11
12    You have installed Django's auth system, and don't have any superusers defined.
13    Would you like to create one now? (yes/no): yes
14    Username (leave blank to use 'root'): root
15    Email address: [email protected]
16    Password: password
17    Password (again): password
18    Superuser created successfully.
运行以下命令,将所有静态文件收集到一个目录中:
1sudo PYTHONPATH=/opt/graphite/webapp/ django-admin.py collectstatic --settings=graphite.settings
您将看到以下输出. 请在提示时回答是:
 1You have requested to collect static files at the destination
 2location as specified in your settings:
 3
 4/opt/graphite/static
 5
 6This will overwrite existing files!
 7Are you sure you want to do this?
 8
 9Type 'yes' to continue, or 'no' to cancel: yes
10Copying '/opt/graphite/webapp/content/js/browser.js'
11Copying '/opt/graphite/webapp/content/js/completer.js'
12...
13407 static files copied to '/opt/graphite/static'.
创建适当的apache用户所拥有的格拉菲特:
1sudo chown -R apache:apache /opt/graphite/storage/
2sudo chown -R apache:apache /opt/graphite/static/
3sudo chown -R apache:apache /opt/graphite/webapp/
要运行 Web 应用程序,你需要的 graphite.wsgi 文件. 此文件包含代码 mod_wsgi 正在启动,以获得应用程序对象. 复制示例文件:
1sudo cp /opt/graphite/conf/graphite.wsgi.example /opt/graphite/conf/graphite.wsgi
配置 Apache. 有关 Apache 虚拟主机的更多信息,请参阅 本教程。
1sudo cp /opt/graphite/examples/example-graphite-vhost.conf /etc/httpd/conf.d/graphite.conf
打开文件以编辑:
1sudo vi /etc/httpd/conf.d/graphite.conf
确保您的ServerName设置为您的域或IP地址。Alias行应该已经正确设置了。
 1. . .
 2
 3ServerName your_server_ip
 4
 5. . .
 6
 7Alias /static/ /opt/graphite/static/
 8
 9<Directory /opt/graphite/static/>
10   Require all granted
11</Directory>
保存并关闭文件。
步骤 5 — 密码保护图形(推荐)
默认情况下,任何知道运行 Web 应用程序的服务器地址的人都可以查看任何数据。
创建一个新的文件夹并设置权限:
1sudo mkdir /opt/graphite/secure
2sudo chown -R apache:apache /opt/graphite/secure
使用htpasswd创建一个新的用户名和密码,将限制访问Graphite Web应用程序. 在下面的示例中,您可以看到如何创建用户sammy并添加一个新的密码:
1sudo htpasswd -c /opt/graphite/secure/.passwd sammy
2New password: password
3Re-type new password: password
4Adding password for user sammy
在要求用户行中,您必须指定与前一步相同的名称:
1sudo vi /etc/httpd/conf.d/graphite.conf
添加这个新的<位置>块到主虚拟主机块中的任何地方:
1<Location "/">
2     AuthType Basic
3     AuthName "Private Area"
4     AuthUserFile /opt/graphite/secure/.passwd
5     Require user sammy
6</Location>
保存并关闭文件。
步骤 6 – 运行图形网页
启动 Apache 服务,并将其添加到启动时:
1sudo systemctl start httpd
2sudo systemctl enable httpd
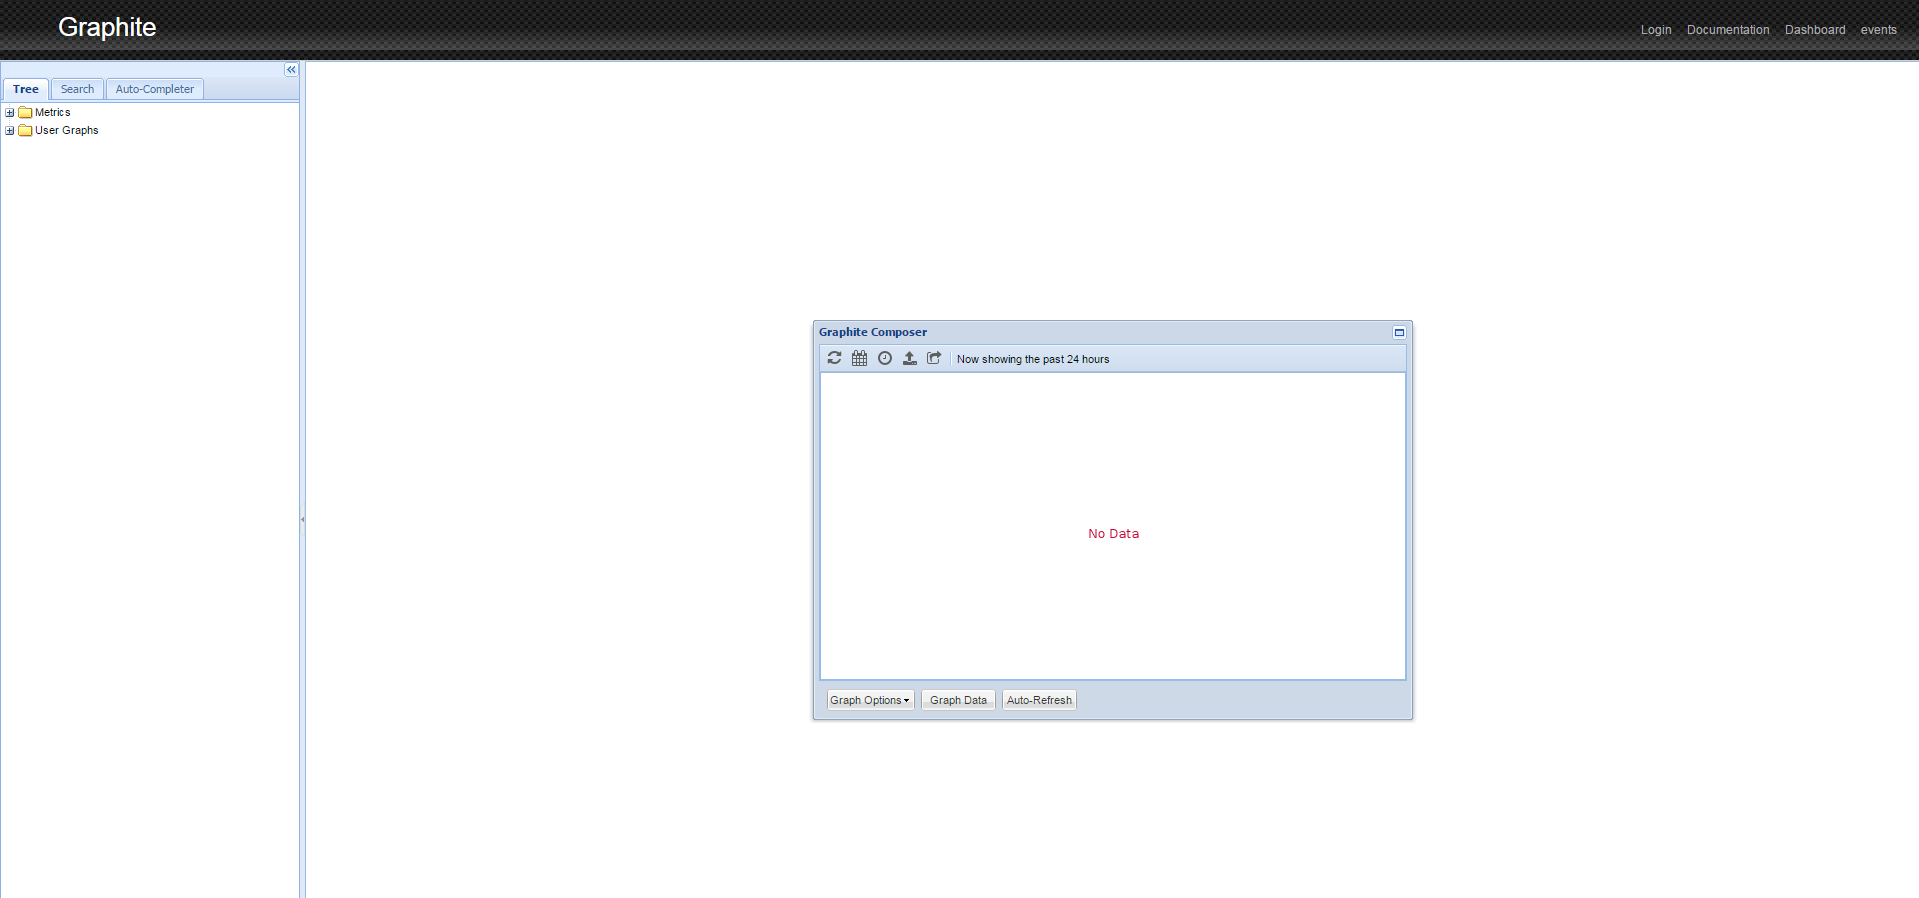
安装完成了! 启动您的浏览器并前往地址 http://your_server_ip/。
输入您在步骤 5 中设置的用户名和密码。
你会看到以下:
步骤 7 — 从 collectd 发布指标
Graphite 可以使用来自许多不同的监控服务的数据. 在本示例中,我们将使用 collectd. 它是定期收集系统性能统计数据的 DAEMON,并提供以各种方式存储或发送值的机制。
有关 collectd 的更多信息可在 官方网站上找到。
安装收集:
1sudo yum install collectd
配置文件包含许多设置. 打开文件以编辑:
1sudo vi /etc/collectd.conf
完成以下内容:
- 設定「主機名稱」在全球設定中. 這可以是您想要的任何名稱,並將在網頁接口中使用來指定這個主機。
1Hostname "Monitor"
- 不对‘write_graphite’插件设置进行评估
1LoadPlugin write_graphite
- 將「
」區塊中的設定編輯為以下:
 1<Plugin write_graphite>
 2  <Node "localhost">
 3    Host "localhost"
 4    Port "2003"
 5  Protocol "tcp"
 6 LogSendErrors true
 7  Prefix "collectd."
 8    # Postfix "collectd"
 9  StoreRates true
10   AlwaysAppendDS false
11  EscapeCharacter "_"
12  </Node>
13</Plugin>
The main parameters of the write_graphite plugin:
Host(required) — the hostname of the Carbon collection agent. In our case it's working on the localhostPort(required) — the port used by the Carbon collect agent. In our example,carbon-relaylistens on port2003Prefix— the prefix string prepended to the hostname that is sent to Carbon. We've added the point so Graphite can automatically group the hostsPostfix— the postfix string prepended to the hostname that is sent to Carbon. We do not need this option because we set the prefix, so you may disable it
Start collect to start sending metrics to Graphite:
1
2sudo systemctl 开始收集服务
<$>[note]
Note: To troubleshoot, check the status of ollectd status with the command sudo systemctl status collectd.service. This will show you if it's having any trouble writing to Graphite.
<$>
Collectd immediately begins to send data to the Graphite. Refresh the web page. If you expand the Metrics folder, you should see collectd listed. After some time, you will be able to see the pretty graphs of your data as shown below.
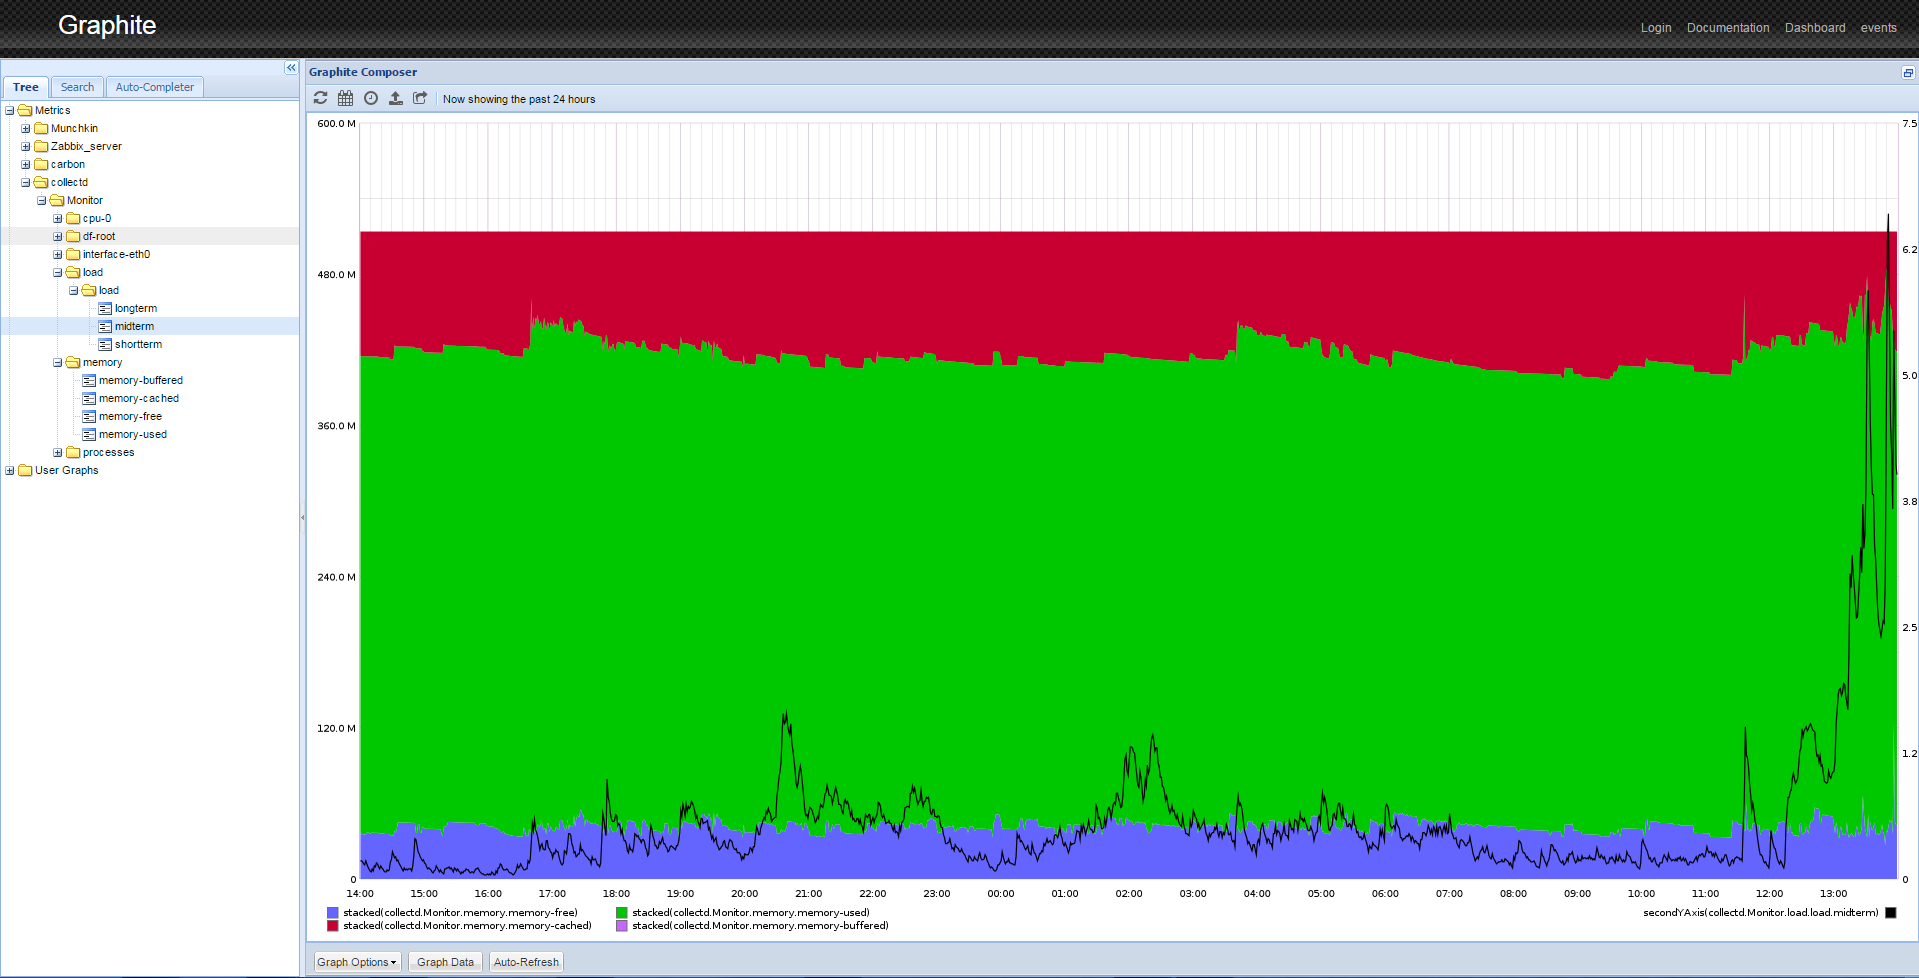
Step 8 — Manipulating Data
Graphite has sophisticated data display options. For example, to obtain an image similar to one shown in the image above, you need to perform several actions.
- From the left panel, click Metrics > collectd > Monitor (or the
Hostnameyou configured in Step 7) > load > load > midterm. You will see the graph of the load average.
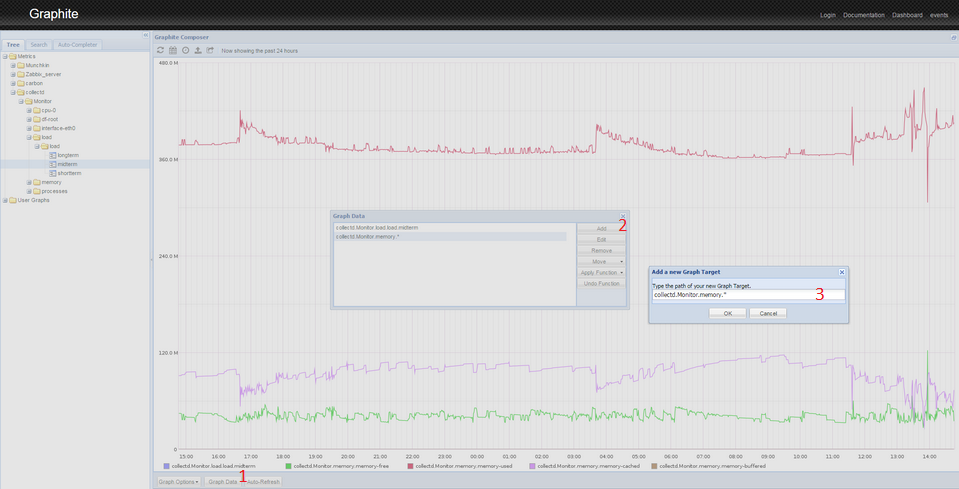
- Click the Graph Data button below the graph.
- Click the Add button on the right of the popup.
- Paste the following line:
collectd.Monitor.memory.*. This will select all of the memory-related graphs. If you used a different name for your host, use that name instead ofMonitor. - Press OK. You will see several graphs on a single screen. Because of differences in scale, the load curve turned into a line. To fix this, you must perform the following manipulations with the graphs.
- Click the Graph Data button again.
- Select the
collectd.Monitor.load.load.midtermline. - Click the Apply Function button.
- Select Special > Draw in Second Y Axis
- Click Apply Function again.
- Select Special > Color.
- Enter
blackand press OK. - Select the
collectd.Monitor.memory.*line. - Click Apply Function.
- Select Special > Draw Stacked.
- You will see the image similar to one shown at the end of Step 7.
This is just one way to display the data from your server. You can mix and combine different data on the same graph, apply different functions, scale data, calculate moving averages, forecast data, and so on.
Conclusion
Graphite is a powerful tool for storing and analyzing time series data. After completing this tutorial you should have a general understanding of how to install it, do basic setup, get your data into it, and manipulate the accumulated data.
Graphite can be used as dashboard. You can monitor key indicators: CPU utilization, memory usage, utilization of network interfaces, and so on.
Graphite has many functions for data analysis. You can use those functions to transform, combine, and perform computations on series data. Most functions can be applied sequentially. For example, you can summarize incoming traffic from all branch offices, and than compare it to the sum of outgoing traffic. Or you can summarize all incoming and outgoing traffic from all branch offices, build a summary graph over a long period of time, and see the trend for future capacity planning.