作为一种统计语言,R提供了标准函数SD(‘’)来求出值的标准偏差。
那么标准差是多少?
- ‘标准差是数值分散程度的量度。
- 标准差越高,价值差越广
- 标准差越低,价值差越窄
- 简单地说,公式定义为- 标准差是‘方差’的平方根。**
标准差重要性
标准差在统计中很受欢迎,但为什么呢?它受欢迎的原因和重要性如下所示。
- 标准差通过 平方** 将负数转换为正数。
- 它显示 较大的偏差** ,以便您可以特别查看它们。
- 它显示了 中心趋势** ,这在分析中是一个非常有用的函数。
- 它在 金融、商业、分析和测量方面发挥着重要作用。**
在我们进入主题之前,请记住这个定义!
方差 -定义为观测值与期望值的平方差。
查找列表中值在R中的标准差
在这个方法中,我们将创建一个[list](/community/tutorials/lists-in-r)'x'并向其添加一些值。然后我们可以找到列表中这些值的标准差。
1x <- c(34,56,87,65,34,56,89)    #creates list 'x' with some values in it.
2
3 sd(x)  #calculates the standard deviation of the values in the list 'x'
输出->22.28175
现在,我们可以尝试从列表‘y’中提取特定值,以求出标准偏差。
1y <- c(34,65,78,96,56,78,54,57,89)  #creates a list 'y' having some values
2
3data1 <- y[1:5] #extract specific values using its Index
4
5sd(data1) #calculates the standard deviation for Indexed or extracted values from the list.
输出->23.28519
查找CSV文件中存储的值的标准差
在此方法中,我们导入CSV文件,以求出存储在该文件中的值在R中的标准偏差。
1readfile <- read.csv('testdata1.csv')  #reading a csv file
2
3data2 <- readfile$Values      #getting values stored in the header 'Values'
4
5sd(data2)                              #calculates the standard deviation
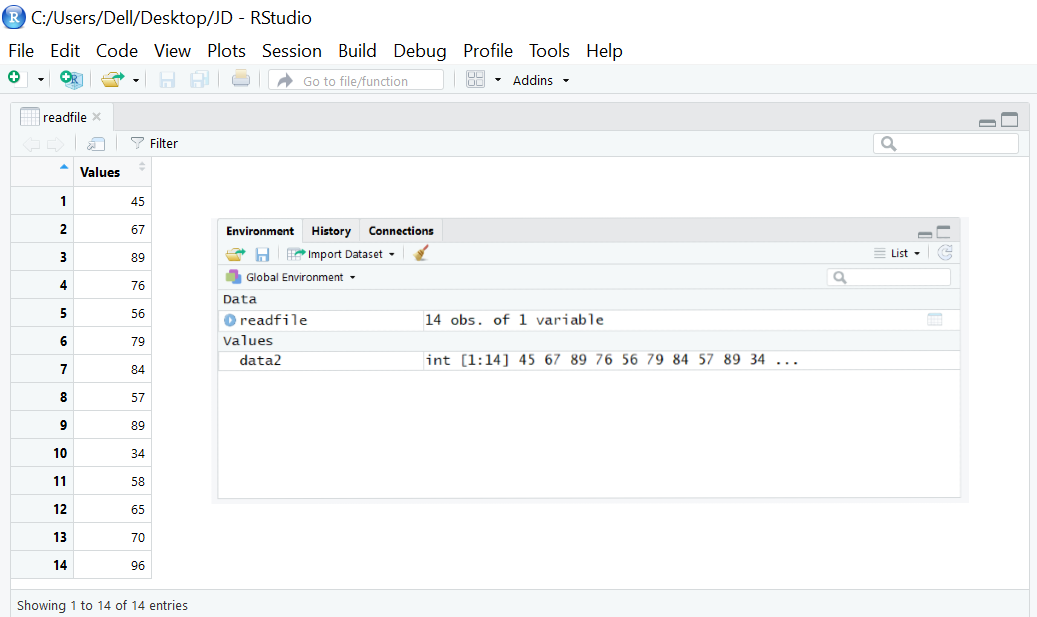
输出->17.88624
高、低标准差
一般来说,这些值会非常接近低标准差 的平均值,而会远离** 高标准差** 的平均值。
我们可以用一个例子来说明这一点。
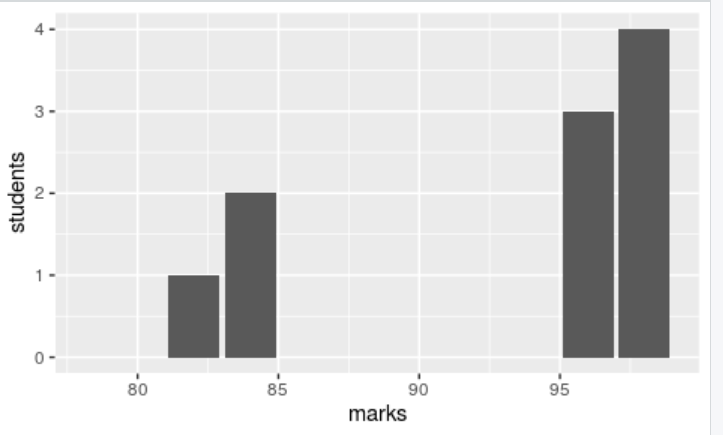
1x <- c(79,82,84,96,98)
2mean(x)
3--->  82.22222
4sd(x)
5--->  10.58038
要使用In R在条形图中绘制这些值,请运行以下代码。
要安装ggplot2包,请在R Studio中运行此代码。
->安装包()
 1library(ggplot2)
 2
 3values <- data.frame(marks=c(79,82,84,96,98), students=c(0,1,2,3,4,))
 4head(values)                  #displayes the values
 5 marks students
 61 79 0
 72 82 1
 83 84 2
 94 96 3
105 98 4
11x <- ggplot(values, aes(x=marks, y=students))+geom_bar(stat='identity')
12x                             #displays the plot
 格式
格式
在上面的结果中,您可以观察到大部分数据都在平均值(79,82,84)附近聚集,这表明它是低标准差 。
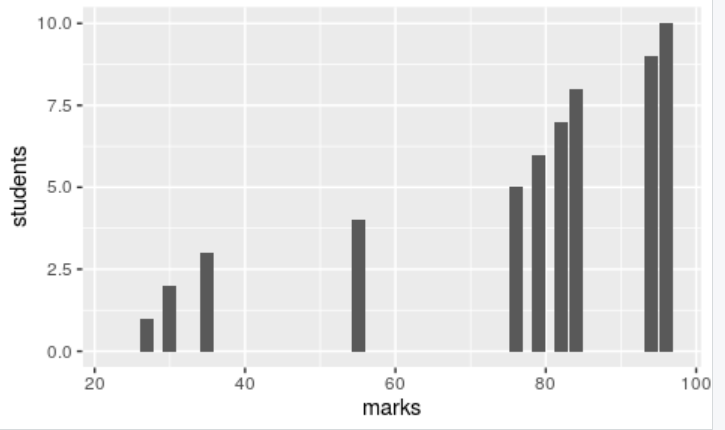
高标准差 的插图。
1y <- c(23,27,30,35,55,76,79,82,84,94,96)
2mean(y)
3---> 61.90909
4sd(y)
5---> 28.45507
要在R中使用条形图绘制这些值,请运行以下代码。
 1library(ggplot2)
 2
 3values <- data.frame(marks=c(23,27,30,35,55,76,79,82,84,94,96), students=c(0,1,2,3,4,5,6,7,8,9,10))
 4head(values)                  #displayes the values
 5  marks students
 61 23 0
 72 27 1
 83 30 2
 94 35 3
105 55 4
116 76 5
12x <- ggplot(values, aes(x=marks, y=students))+geom_bar(stat='identity')
13x                             #displays the plot
在上面的结果中,你可以看到广泛的数据。你可以看到最低分23,这是非常远离平均分61。这被称为 高标准差
至此,您已经对在R语言中使用SD(‘’)函数计算标准偏差有了很好的了解。让我们通过解决简单的问题来总结本教程。
示例 1:偶数列表的标准差
求1-20之间偶数的标准差(不包括1-20)。
解决方案: 1到20之间的偶数为,
-2、4、6、8、10、12、14、16、18
让我们找出这些值的标准差。
1x <- c(2,4,6,8,10,12,14,16,18)  #list of even numbers from 1 to 20
2
3sd(x)                           #calculates the standard deviation of these
4                            values in the list of even numbers from 1 to 20
输出->5.477226
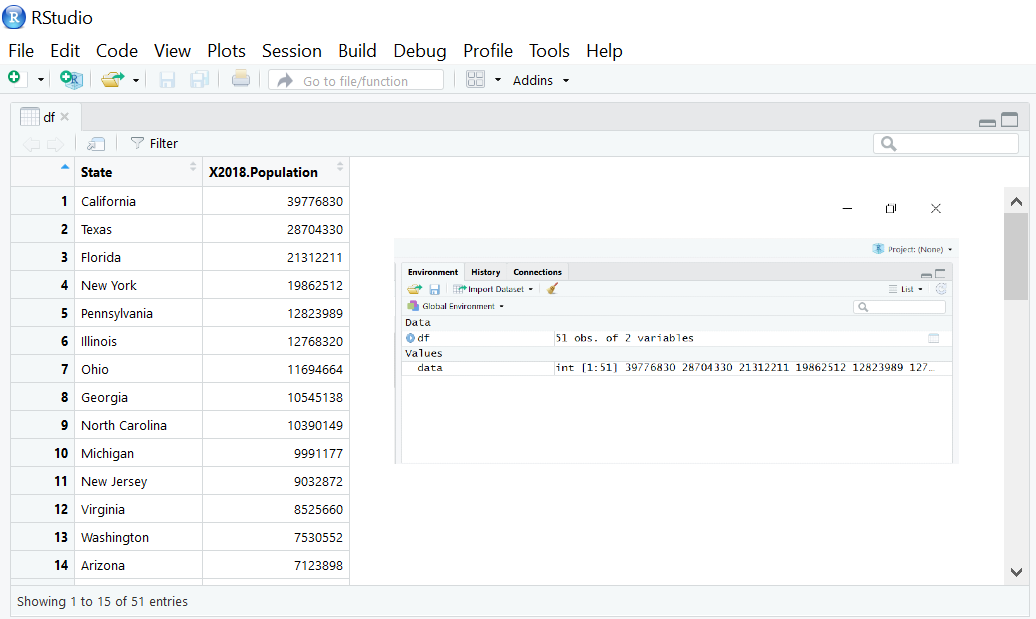
示例 2:美国人口数据标准差
求出美国各州人口的标准差。
为此,导入CSV文件并读取值以找到标准偏差,并将结果绘制在R的直方图中。
1df<-read.csv("population.csv")      #reads csv file
2data<-df$X2018.Population           #extarcts the data from population
3                                     column
4mean(data)                          #calculates the mean
5
6View(df)                            #displays the data
7sd(data)                            #calculates the standard deviation
 中的标准差
中的标准差
Output ->** mean** =6432008,** Sd** =7376752
结论
找到R中值的标准差很容易。R提供标准函数SD(‘’)以求出标准偏差。您可以创建值列表或导入CSV文件来查找标准偏差。
重要提示: 不要忘记通过索引从文件或列表中提取一些值来计算标准差,如上所示。
使用评论框来发布任何关于R中sd(' ')函数的疑问。学习愉快!